Dollar General logged a -0.5% change during today's morning session, and is now trading at a price of $129.4 per share.
Dollar General returned losses of -46.8% last year, with its stock price reaching a high of $251.0 and a low of $101.09. Over the same period, the stock underperformed the S&P 500 index by -69.8%. As of April 2023, the company's 50-day average price was $121.67. Dollar General Corporation, a discount retailer, provides various merchandise products in the southern, southwestern, midwestern, and eastern United States. Based in Goodlettsville, TN, the large-cap Consumer Discretionary company has 170,000 full time employees. Dollar General has offered a 1.8% dividend yield over the last 12 months.
Growing Revenues With Increasing Reinvestment in the Business:
| 2018 | 2019 | 2020 | 2021 | 2022 | 2023 | |
|---|---|---|---|---|---|---|
| Revenue (MM) | $23,471 | $25,625 | $27,754 | $33,747 | $34,220 | $37,845 |
| Revenue Growth | n/a | 9.18% | 8.31% | 21.59% | 1.4% | 10.59% |
| Operating Margins | 9% | 8% | 8% | 11% | 10% | 9% |
| Net Margins | 7% | 6% | 6% | 8% | 7% | 6% |
| Net Income (MM) | $1,539 | $1,589 | $1,713 | $2,655 | $2,399 | $2,416 |
| Net Interest Expense (MM) | $97 | $100 | $101 | $150 | $160 | $211 |
| Depreciation & Amort. (MM) | $404 | $454 | $505 | $574 | $641 | $725 |
| Earnings Per Share | $5.63 | $5.97 | $6.64 | $10.62 | $10.17 | $10.68 |
| EPS Growth | n/a | 6.04% | 11.22% | 59.94% | -4.24% | 5.01% |
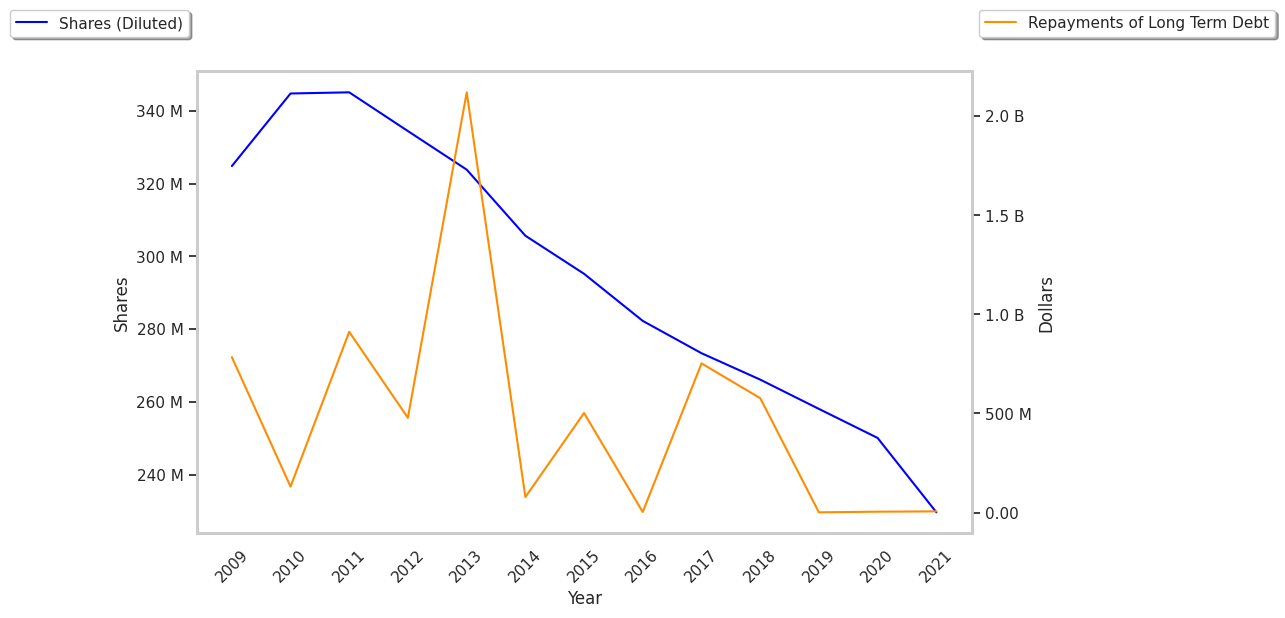
| Diluted Shares (MM) | 273 | 266 | 258 | 250 | 236 | 226 |
| Free Cash Flow (MM) | $1,156 | $1,409 | $1,453 | $2,848 | $1,795 | $424 |
| Capital Expenditures (MM) | $646 | $734 | $785 | $1,028 | $1,070 | $1,561 |
| Current Ratio | 1.55 | 1.12 | 1.28 | 1.08 | 1.23 | 1.39 |
| Total Debt (MM) | $2,904 | $2,763 | $2,912 | $2,912 | $6,092 | $7,545 |
| Net Debt / EBITDA | 1.1 | 0.97 | 0.25 | 0.59 | 1.42 | 1.77 |
Dollar General has growing revenues and increasing reinvestment in the business and decent operating margins with a stable trend. Additionally, the company's financial statements display a strong EPS growth trend and healthy leverage. However, the firm has irregular cash flows.
A Very Low P/E Ratio but Trades Above Its Graham Number:
Dollar General has a trailing twelve month P/E ratio of 14.0, compared to an average of 22.96 for the Consumer Discretionary sector. Based on its EPS guidance of $7.54, the company has a forward P/E ratio of 16.1. The 4.3% compound average growth rate of Dollar General's historical and projected earnings per share yields a PEG ratio of 3.29. This suggests that these shares are overvalued. The market is placing a fair value on Dollar General's equity, since its P/B ratio of 4.4 is comparable to its sector average of 4.24. The company's shares are currently trading 57.9% above their Graham number.
Dollar General Has an Average Rating of Buy:
The 27 analysts following Dollar General have set target prices ranging from $100.0 to $187.0 per share, for an average of $138.84 with a buy rating. As of April 2023, the company is trading -12.4% away from its average target price, indicating that there is an analyst consensus of some upside potential.
Dollar General has an average amount of shares sold short because 2.7% of the company's shares are sold short. Institutions own 91.6% of the company's shares, and the insider ownership rate stands at 0.25%, suggesting a small amount of insider investors. The largest shareholder is Vanguard Group Inc, whose 10% stake in the company is worth $2,809,347,601.