T-Mobile US logged a -0.9% change during today's afternoon session, and is now trading at a price of $154.5 per share.
T-Mobile US returned gains of 10.2% last year, with its stock price reaching a high of $161.19 and a low of $124.92. Over the same period, the stock underperformed the S&P 500 index by -12.8%. As of April 2023, the company's 50-day average price was $147.83. T-Mobile US, Inc., together with its subsidiaries, provides mobile communications services in the United States, Puerto Rico, and the United States Virgin Islands. Based in Bellevue, WA, the large-cap Telecommunications company has 71,000 full time employees. T-Mobile US has offered a 0.4% dividend yield over the last 12 months.
Growing Revenues With Increasing Reinvestment in the Business:
| 2018 | 2019 | 2020 | 2021 | 2022 | 2023 | |
|---|---|---|---|---|---|---|
| Revenue (MM) | $43,310 | $44,998 | $68,397 | $80,118 | $79,571 | $78,353 |
| Revenue Growth | n/a | 3.9% | 52.0% | 17.14% | -0.68% | -1.53% |
| Operating Margins | 12% | 13% | 10% | 9% | 8% | 17% |
| Net Margins | 7% | 8% | 4% | 4% | 3% | 10% |
| Net Income (MM) | $2,888 | $3,468 | $3,064 | $3,024 | $2,590 | $7,780 |
| Net Interest Expense (MM) | $835 | $727 | $2,483 | $3,189 | -$33 | $58 |
| Depreciation & Amort. (MM) | $6,486 | $6,616 | $14,151 | $16,383 | $13,651 | $12,762 |
| Earnings Per Share | $3.36 | $4.02 | $2.65 | $2.41 | $2.06 | $6.44 |
| EPS Growth | n/a | 19.64% | -34.08% | -9.06% | -14.52% | 212.62% |
| Diluted Shares (MM) | 858 | 863 | 1,155 | 1,255 | 1,255 | 1,081 |
| Free Cash Flow (MM) | -$1,642 | $433 | -$2,394 | $1,591 | $2,811 | $6,439 |
| Capital Expenditures (MM) | $5,541 | $6,391 | $11,034 | $12,326 | $13,970 | $11,597 |
| Current Ratio | 0.81 | 0.74 | 1.1 | 0.89 | 0.77 | 0.86 |
| Total Debt (MM) | $12,965 | $11,965 | $67,472 | $71,574 | $71,626 | $72,758 |
| Net Debt / EBITDA | 1.0 | 0.85 | 2.75 | 2.79 | 3.32 | 2.58 |
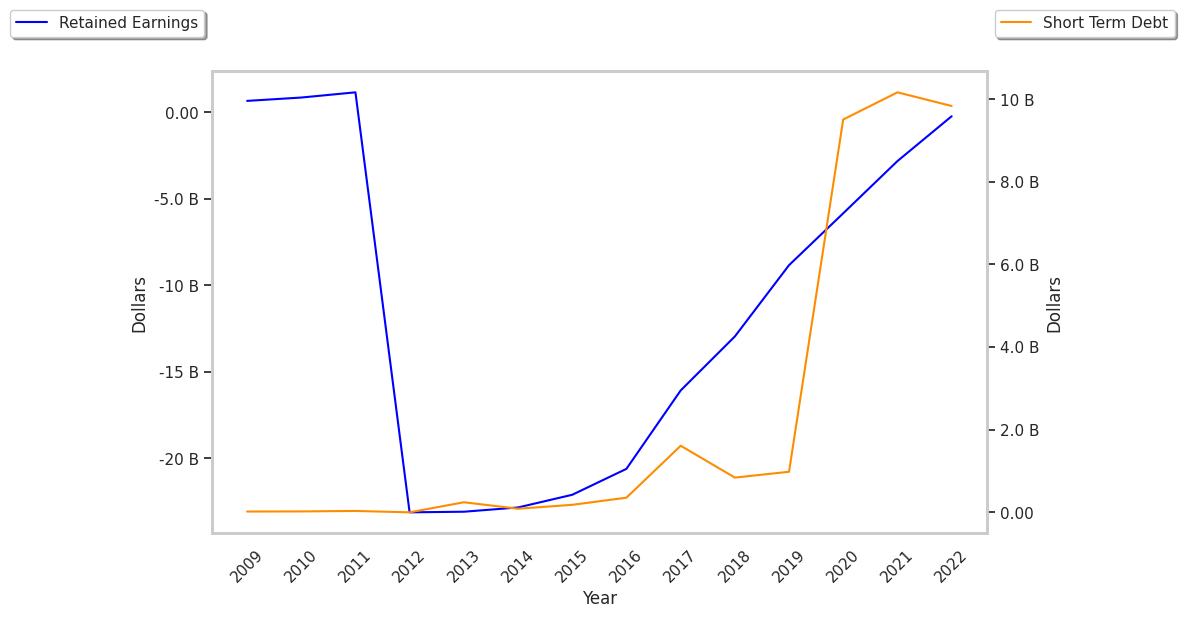
T-Mobile US has growing revenues and increasing reinvestment in the business, a strong EPS growth trend, and irregular cash flows. However, the firm has weak operating margins with a positive growth rate. Finally, we note that T-Mobile US has significant leverage.
T-Mobile US's Valuation Is in Line With Its Sector Averages:
T-Mobile US has a trailing twelve month P/E ratio of 23.0, compared to an average of 23.78 for the Telecommunications sector. Based on its EPS guidance of $9.96, the company has a forward P/E ratio of 14.8. According to the 16.8% compound average growth rate of T-Mobile US's historical and projected earnings per share, the company's PEG ratio is 1.37. Taking the weighted average of the company's EPS CAGR and the broader market's 5-year projected EPS growth rate, we obtain a normalized growth rate of 9.9%. On this basis, the company's PEG ratio is 2.33. This suggests that these shares are overvalued. In contrast, the market is likely undervaluing T-Mobile US in terms of its equity because its P/B ratio is 2.77 while the sector average is 3.46. The company's shares are currently trading 65.6% above their Graham number.
T-Mobile US Has an Analyst Consensus of Some Upside Potential:
The 28 analysts following T-Mobile US have set target prices ranging from $129.91 to $235.0 per share, for an average of $179.43 with a buy rating. As of April 2023, the company is trading -17.6% away from its average target price, indicating that there is an analyst consensus of some upside potential.
T-Mobile US has an average amount of shares sold short because 4.7% of the company's shares are sold short. Institutions own 42.2% of the company's shares, and the insider ownership rate stands at 56.66%, suggesting a large amount of insider shareholders. The largest shareholder is Softbank Group Corporation, whose 4% stake in the company is worth $6,695,536,387.