Now trading at a price of $28.67, Pfizer has moved -0.4% so far today.
Pfizer returned losses of -43.8% last year, with its stock price reaching a high of $51.6 and a low of $25.76. Over the same period, the stock underperformed the S&P 500 index by -68.4%. As of April 2023, the company's 50-day average price was $29.55. Pfizer Inc. discovers, develops, manufactures, markets, distributes, and sells biopharmaceutical products worldwide. Based in New York, NY, the large-cap Health Care company has 83,000 full time employees. Pfizer has offered a 5.7% dividend yield over the last 12 months.
Growing Revenues With Increasing Reinvestment in the Business:
| 2018 | 2019 | 2020 | 2021 | 2022 | 2023 | |
|---|---|---|---|---|---|---|
| Revenue (MM) | $40,825 | $40,905 | $41,651 | $81,288 | $100,330 | $68,537 |
| Revenue Growth | n/a | 0.2% | 1.82% | 95.16% | 23.43% | -31.69% |
| Operating Margins | 9% | 28% | 17% | 30% | 35% | 15% |
| Net Margins | 27% | 39% | 22% | 28% | 31% | 15% |
| Net Income (MM) | $11,188 | $16,056 | $9,195 | $22,459 | $31,407 | $10,521 |
| Net Interest Expense (MM) | $1,316 | $1,573 | $1,449 | $4,878 | $1,238 | $1,833 |
| Earnings Per Share | $1.87 | $2.82 | $1.63 | $3.85 | $5.47 | $1.8200000000000005 |
| EPS Growth | n/a | 50.8% | -42.2% | 136.2% | 42.08% | -66.73% |
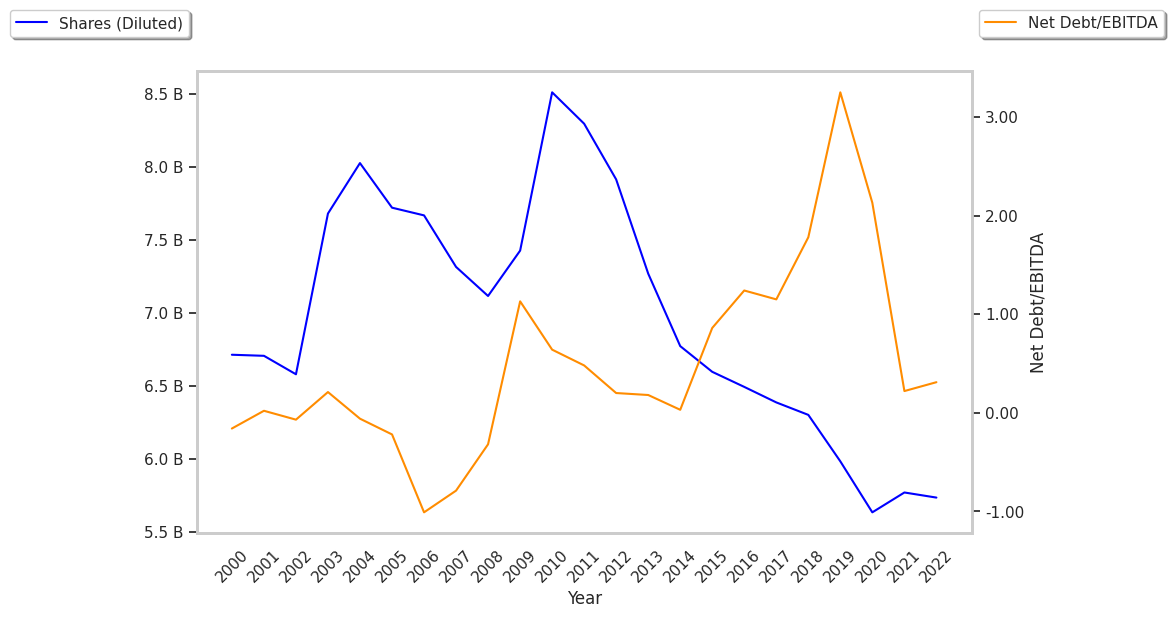
| Diluted Shares (MM) | 5,977 | 5,675 | 5,632 | 5,708 | 5,733 | 5,631 |
| Free Cash Flow (MM) | $13,843 | $10,542 | $12,177 | $30,211 | $26,031 | $18,866 |
| Capital Expenditures (MM) | $1,984 | $2,046 | $2,226 | $2,711 | $3,236 | $3,864 |
| Current Ratio | 1.57 | 0.88 | 1.35 | 1.4 | 1.22 | 2.38 |
| Total Debt (MM) | $41,740 | $52,150 | $43,111 | $40,684 | $38,131 | $63,596 |
Pfizer has growing revenues and increasing reinvestment in the business and healthy debt levels. Additionally, the company's financial statements display decent operating margins with a positive growth rate and irregular cash flows. Furthermore, Pfizer has flat EPS growth.
A Lower P/B Ratio Than Its Sector Average but Trades Above Its Graham Number:
Pfizer has a trailing twelve month P/E ratio of 16.1, compared to an average of 30.21 for the Health Care sector. Based on its EPS guidance of $2.0, the company has a forward P/E ratio of 14.8. The 1.0% compound average growth rate of Pfizer's historical and projected earnings per share yields a PEG ratio of 16.74. This suggests that these shares are overvalued. In contrast, the market is likely undervaluing Pfizer in terms of its equity because its P/B ratio is 1.67 while the sector average is 4.08. The company's shares are currently trading 7.1% above their Graham number.
Analysts Give Pfizer an Average Rating of Buy:
The 21 analysts following Pfizer have set target prices ranging from $20.7 to $45.01 per share, for an average of $29.15 with a buy rating. As of April 2023, the company is trading 1.4% away from its average target price, indicating that there is an analyst consensus of some upside potential.
Pfizer has a very low short interest because 1.1% of the company's shares are sold short. Institutions own 70.6% of the company's shares, and the insider ownership rate stands at 0.04%, suggesting a small amount of insider investors. The largest shareholder is Vanguard Group Inc, whose 9% stake in the company is worth $14,527,839,504.