CME logged a -1.8% change during Friday's trading session, and is now trading at a price of $199.19 per share.
CME returned gains of 13.3% last year, with its stock price reaching a high of $223.8 and a low of $171.93. Over the same period, the stock underperformed the S&P 500 index by -7.4%. As of April 2023, the company's 50-day average price was $212.72. CME Group Inc., together with its subsidiaries, operates contract markets for the trading of futures and options on futures contracts worldwide. Based in Chicago, IL, the large-cap Finance company has 3,460 full time employees. CME has offered a 2.1% dividend yield over the last 12 months.
The Company's Revenues Are Declining:
| 2018 | 2019 | 2020 | 2021 | 2022 | 2023 | |
|---|---|---|---|---|---|---|
| Revenue (MM) | $4,309 | $4,868 | $4,884 | $4,690 | $5,019 | $5,347 |
| Revenue Growth | n/a | 12.96% | 0.32% | -3.97% | 7.03% | 6.53% |
| Interest Income (MM) | $158 | $178 | $166 | $167 | $163 | $160 |
| Operating Margins | 61% | 53% | 54% | 56% | 60% | 61% |
| Net Margins | 46% | 43% | 43% | 56% | 54% | 50% |
| Net Income (MM) | $1,964 | $2,116 | $2,105 | $2,636 | $2,691 | $2,691 |
| Depreciation & Amort. (MM) | $119 | $159 | $311 | $148 | $135 | $228 |
| Earnings Per Share | $5.71 | $5.91 | $5.87 | $7.29 | $7.4 | $8.39 |
| EPS Growth | n/a | 3.5% | -0.68% | 24.19% | 1.51% | 13.38% |
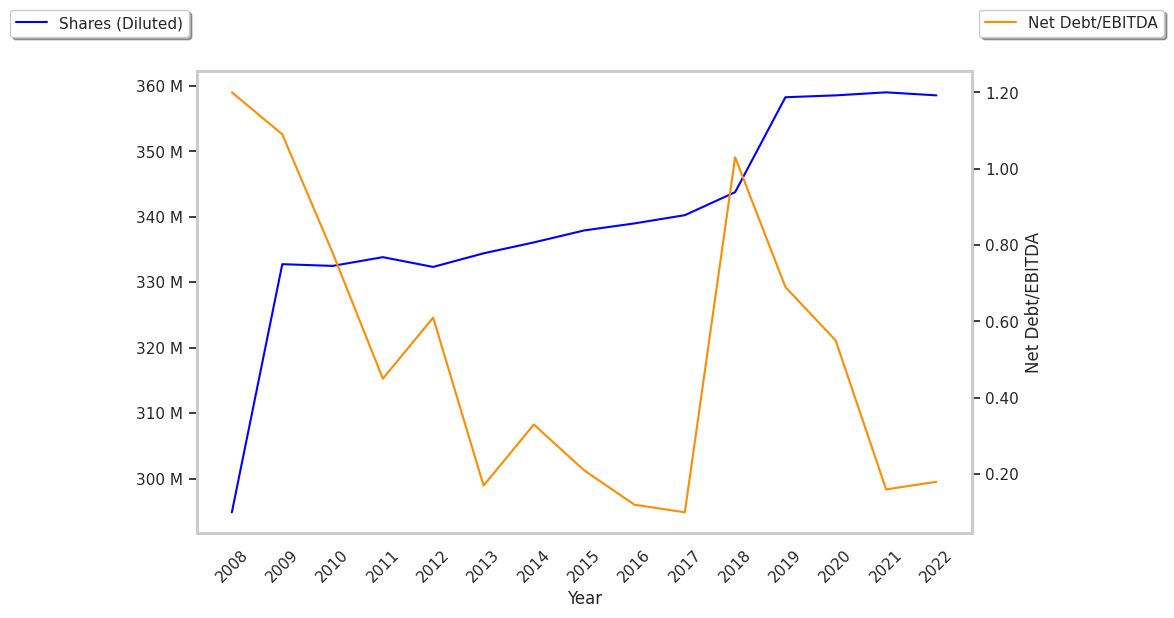
| Diluted Shares (MM) | 344 | 358 | 359 | 359 | 359 | 360 |
| Free Cash Flow (MM) | $2,324 | $2,427 | $2,518 | $2,275 | $2,966 | $3,311 |
| Capital Expenditures (MM) | $117 | $246 | $198 | $127 | $90 | $80 |
| Current Ratio | 1.01 | 1.03 | 1.01 | 1.01 | 1.01 | 1.03 |
CME has strong margins with a stable trend, positive EPS growth, and irregular cash flows. However, the firm has weak revenue growth and decreasing reinvestment in the business.
CME's Valuation Is in Line With Its Sector Averages:
CME has a trailing twelve month P/E ratio of 25.4, compared to an average of 12.38 for the Finance sector. Based on its EPS guidance of $9.43, the company has a forward P/E ratio of 22.6. The 7.4% compound average growth rate of CME's historical and projected earnings per share yields a PEG ratio of 3.41. This suggests that these shares are overvalued. Furthermore, CME is likely overvalued compared to the book value of its equity, since its P/B ratio of 2.54 is higher than the sector average of 1.58. The company's shares are currently trading 63.9% above their Graham number.
CME Has an Analyst Consensus of Some Upside Potential:
The 14 analysts following CME have set target prices ranging from $180.0 to $250.0 per share, for an average of $227.43 with a buy rating. As of April 2023, the company is trading -6.5% away from its average target price, indicating that there is an analyst consensus of some upside potential.
CME has a very low short interest because 1.1% of the company's shares are sold short. Institutions own 89.5% of the company's shares, and the insider ownership rate stands at 0.44%, suggesting a small amount of insider investors. The largest shareholder is Vanguard Group Inc, whose 9% stake in the company is worth $6,620,308,799.