Nucor may be undervalued with mixed growth prospects, but the 9 analysts following the company give it an rating of hold. Their target prices range from $39.0 to $190.0 per share, for an average of $160.33. At today's price of $170.57, Nucor is trading 6.39% away from its average target price, suggesting there is an analyst consensus of little upside potential for the stock.
Nucor Corporation engages in manufacture and sale of steel and steel products. Based in Charlotte, NC, the large-cap Industrials company has 31,400 full time employees. Nucor has provided a 1.2% dividend yield over the last 12 months.
Nucor has a trailing twelve month P/E ratio of 8.6, compared to an average of 22.19 for the Industrials sector. Considering its EPS guidance of $12.44, the company has a forward P/E ratio of 13.7.
The average compound growth rate of the company's historical and projected earnings per share is 7.7%. On this basis, the company's PEG ratio is 1.07. However, this growth rate is probably not sustainable. In its place we will use the broader market's estimated 5-year EPS growth rate of 7.3%, which gives us a PEG ratio of 1.13. This shows that Nucor is fairly priced.
Furthermore, the market is potentially undervaluing Nucor in terms of its book value because its P/B ratio is 2.05. In comparison, the sector average P/B ratio is 4.06. The company's shares are currently -10.7% below their Graham number, indicating that its shares have a margin of safety.
If analysts are giving the stock a bad rating, it's likely that they are looking beyond simple valaution metrics and attempting to forecast the company's growth potential. For example, Nucor has narrow margins as you can see in the financial summary below.
| 2018 | 2019 | 2020 | 2021 | 2022 | 2023 | |
|---|---|---|---|---|---|---|
| Revenue (MM) | $25,067 | $22,589 | $20,140 | $36,484 | $41,512 | $35,733 |
| Revenue Growth | n/a | -9.89% | -10.84% | 81.15% | 13.78% | -13.92% |
| Operating Margins | 13% | 8% | 4% | 25% | 25% | 19% |
| Net Margins | 9% | 6% | 4% | 19% | 18% | 14% |
| Net Income (MM) | $2,361 | $1,271 | $721 | $6,827 | $7,607 | $4,995 |
| Net Interest Expense (MM) | $161 | $157 | $167 | $163 | $219 | $243 |
| Depreciation & Amort. (MM) | $631 | $649 | $702 | $735 | $827 | $898 |
| Earnings Per Share | $7.42 | $4.14 | $2.36 | $23.16 | $28.79 | $19.72 |
| EPS Growth | n/a | -44.2% | -43.0% | 881.36% | 24.31% | -31.5% |
| Diluted Shares (MM) | 317 | 306 | 303 | 293 | 263 | 249 |
| Free Cash Flow (MM) | $1,411 | $1,332 | $1,154 | $4,609 | $8,124 | $6,111 |
| Capital Expenditures (MM) | $983 | $1,477 | $1,543 | $1,622 | $1,948 | $2,014 |
| Current Ratio | 3.08 | 3.34 | 3.61 | 2.48 | 3.39 | 3.72 |
| Total Debt (MM) | $4,291 | $4,321 | $5,283 | $5,577 | $6,642 | $6,621 |
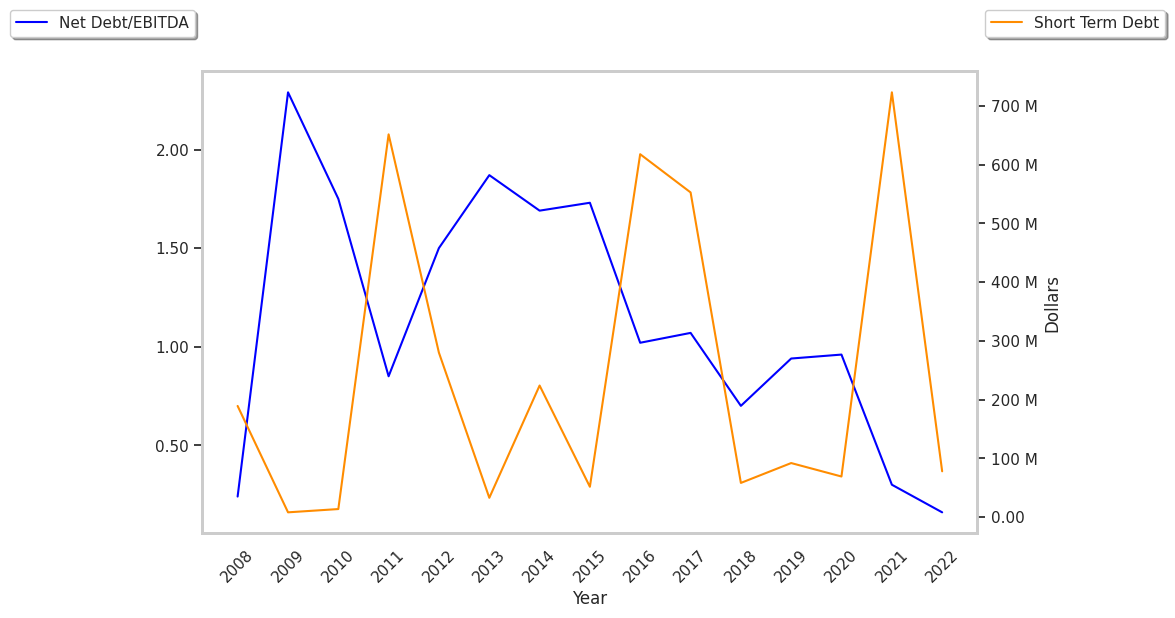
| Net Debt / EBITDA | 0.75 | 1.15 | 1.72 | 0.32 | 0.21 | 0.1 |