Today we're going to take a closer look at large-cap Consumer Discretionary company Southwest Airlines Company, whose shares are currently trading at $29.25. We've been asking ourselves whether the company is under or over valued at today's prices... let's perform a brief value analysis to find out!
A Lower P/B Ratio Than Its Sector Average but Trades Above Its Graham Number:
Southwest Airlines Co. operates as a passenger airline company that provide scheduled air transportation services in the United States and near-international markets. The company belongs to the Consumer Discretionary sector, which has an average price to earnings (P/E) ratio of 22.96 and an average price to book (P/B) ratio of 4.24. In contrast, Southwest Airlines Company has a trailing 12 month P/E ratio of 36.1 and a P/B ratio of 1.58.
When we divideSouthwest Airlines Company's P/E ratio by its expected five-year EPS growth rate, we obtain a PEG ratio of 0.71, which indicates that the market is undervaluing the company's projected growth (a PEG ratio of 1 indicates a fairly valued company). Your analysis of the stock shouldn't end here. Rather, a good PEG ratio should alert you that it may be worthwhile to take a closer look at the stock.
Shareholders Are Confronted With a Declining EPS Growth Trend:
| 2018 | 2019 | 2020 | 2021 | 2022 | 2023 | |
|---|---|---|---|---|---|---|
| Revenue (MM) | $21,965 | $22,428 | $9,048 | $15,790 | $23,814 | $25,440 |
| Revenue Growth | n/a | 2.11% | -59.66% | 74.51% | 50.82% | 6.83% |
| Operating Margins | 15% | 13% | -42% | 11% | 4% | 1% |
| Net Margins | 11% | 10% | -34% | 6% | 2% | 2% |
| Net Income (MM) | $2,465 | $2,300 | -$3,074 | $977 | $539 | $497 |
| Net Interest Expense (MM) | $131 | $118 | $349 | $467 | $340 | $262 |
| Depreciation & Amort. (MM) | $1,201 | $1,219 | $1,255 | $1,272 | $1,351 | $1,474 |
| Earnings Per Share | $4.29 | $4.27 | -$5.44 | $1.61 | $0.87 | $0.82 |
| EPS Growth | n/a | -0.47% | -227.4% | 129.6% | -45.96% | -5.75% |
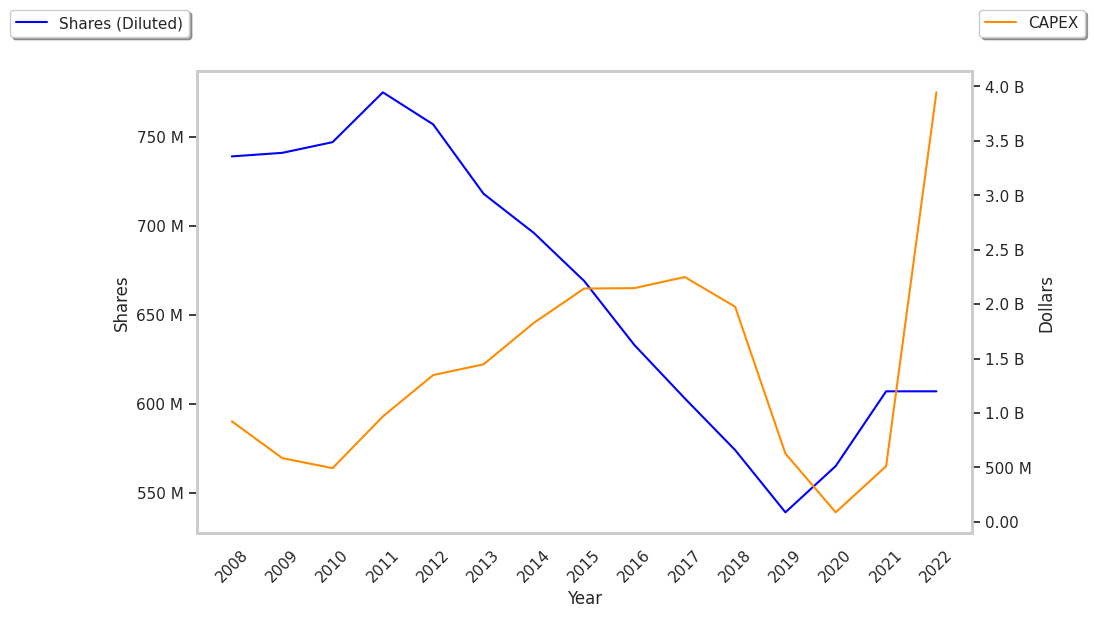
| Diluted Shares (MM) | 574 | 539 | 565 | 609 | 642 | 640 |
| Free Cash Flow (MM) | $2,971 | $2,960 | -$1,642 | $1,817 | -$134 | -$851 |
| Capital Expenditures (MM) | $1,922 | $1,027 | $515 | $505 | $3,924 | $4,168 |
| Current Ratio | 0.64 | 0.67 | 2.02 | 1.97 | 1.43 | 1.21 |
| Total Debt (MM) | $5,542 | $3,692 | $20,222 | $20,548 | $16,092 | $7,984 |
| Net Debt / EBITDA | 0.84 | 0.27 | -3.58 | 2.7 | 2.79 | -0.88 |
Southwest Airlines Company has weak operating margins with a negative growth trend, declining EPS growth, and irregular cash flows. On the other hand, the company benefits from weak revenue growth and increasing reinvestment in the business and healthy leverage.