Now trading at a price of $63.46, Fidelity National Information Services has moved 0.2% so far today.
Fidelity National Information Services returned losses of -8.2% last year, with its stock price reaching a high of $79.32 and a low of $46.91. Over the same period, the stock underperformed the S&P 500 index by -29.7%. As of April 2023, the company's 50-day average price was $56.45. Fidelity National Information Services, Inc. provides technology solutions for financial institutions and businesses worldwide. Based in Jacksonville, FL, the large-cap Consumer Discretionary company has 69,000 full time employees. Fidelity National Information Services has offered a 3.2% dividend yield over the last 12 months.
Increasing Revenues but Narrowing Margins:
| 2018 | 2019 | 2020 | 2021 | 2022 | 2023 | |
|---|---|---|---|---|---|---|
| Revenue (MM) | $8,423 | $10,333 | $12,552 | $13,877 | $14,528 | $14,647 |
| Revenue Growth | n/a | 22.68% | 21.47% | 10.56% | 4.69% | 0.82% |
| Operating Margins | 17% | 9% | 4% | 8% | -111% | -154% |
| Net Margins | 10% | 3% | 1% | 3% | -114% | -166% |
| Net Income (MM) | $846 | $303 | $158 | $417 | -$16,720 | -$24,271 |
| Net Interest Expense (MM) | $314 | $389 | $339 | $216 | $300 | -$88 |
| Depreciation & Amort. (MM) | $17 | $24 | $3,714 | $4,015 | $31 | $3,171 |
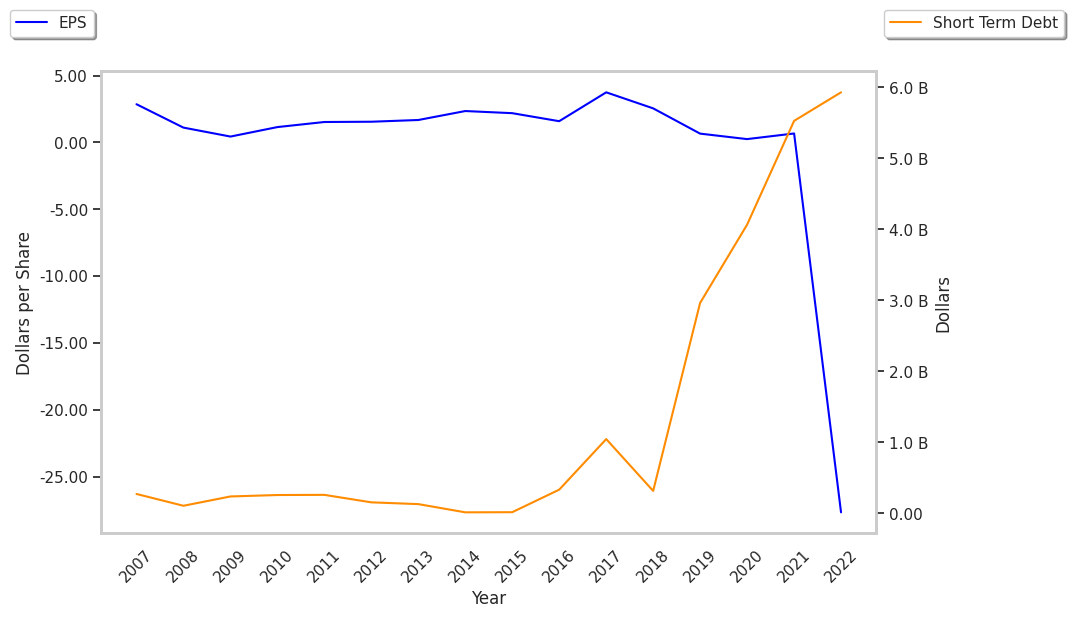
| Earnings Per Share | $2.55 | $0.66 | $0.25 | $0.67 | -$27.68 | -$40.4 |
| EPS Growth | n/a | -74.12% | -62.12% | 168.0% | -4231.34% | -45.95% |
| Diluted Shares (MM) | 332 | 451 | 627 | 621 | 604 | 592 |
| Free Cash Flow (MM) | $1,866 | $2,210 | $4,179 | $4,490 | $3,671 | $3,791 |
| Capital Expenditures (MM) | $127 | $200 | $263 | $320 | $268 | $160 |
| Current Ratio | 1.19 | 0.84 | 0.8 | 0.74 | 0.79 | 0.76 |
| Total Debt (MM) | $17,340 | $34,458 | $31,902 | $29,650 | $28,413 | $12,741 |
Fidelity National Information Services has growing revenues and increasing reinvestment in the business, healthy debt levels, and irregular cash flows. However, the firm suffers from consistently negative margins with a negative growth trend and declining EPS growth.
Fidelity National Information Services does not have a meaningful trailing P/E ratio since its earnings per share are currently in the red. Based on its EPS guidance of $4.55, the company has a forward P/E ratio of 12.4. In comparison, the average P/E ratio for the Consumer Discretionary sector is 22.96. On the other hand, the market is undervaluing Fidelity National Information Services in terms of its equity because its P/B ratio is 1.93. In comparison, the sector average is 4.24. In conclusion, Fidelity National Information Services's impressive cash flow trend, decent P/B ratio, and reasonable use of leverage demonstrate that the company may still be fairly valued — despite its elevated earnings multiple.
Analysts Give Fidelity National Information Services an Average Rating of Buy:
The 23 analysts following Fidelity National Information Services have set target prices ranging from $52.0 to $81.0 per share, for an average of $66.17 with a buy rating. As of April 2023, the company is trading -14.7% away from its average target price, indicating that there is an analyst consensus of some upside potential.
Fidelity National Information Services has a very low short interest because 1.7% of the company's shares are sold short. Institutions own 94.0% of the company's shares, and the insider ownership rate stands at 0.27%, suggesting a small amount of insider investors. The largest shareholder is Blackrock Inc., whose 10% stake in the company is worth $3,731,636,739.