Pharmaceutical company ACADIA Pharmaceuticals is taking Wall Street by surprise today, falling to $28.18 and marking a -3.8% change compared to the S&P 500, which moved -0.0%. ACAD is -16.58% below its average analyst target price of $33.78, which implies there is more upside for the stock.
As such, the average analyst rates it at buy. Over the last year, ACADIA Pharmaceuticals shares have outstripped the S&P 500 by 39.7%, with a price change of 59.8%.
ACADIA Pharmaceuticals Inc., a biopharmaceutical company, focuses on the development and commercialization innovative medicines that address unmet medical needs in central nervous system (CNS) disorders and rare diseases. The company is categorized within the healthcare sector. The catalysts that drive valuations in this sector are complex. From demographics, regulations, scientific breakthroughs, to the emergence of new diseases, healthcare companies see their prices swing on the basis of a variety of factors.
ACADIA Pharmaceuticals does not release its trailing 12 month P/E ratio since its earnings per share of $-0.91 are negative over the last year. But we can calculate it ourselves, which gives us a trailing P/E ratio for ACAD of -31.0. Based on the company's positive earnings guidance of $1.01, the stock has a forward P/E ratio of 27.9. The P/E ratio is the company's share price divided by its earnings per share. In other words, it represents how much investors are willing to spend for each dollar of the company's earnings (revenues minus the cost of goods sold, taxes, and overhead). As of the first quarter of 2023, the health care sector has an average P/E ratio of 30.21, and the average for the S&P 500 is 15.97.
A significant limitation with the price to earnings analysis is that it doesn’t account for investors’ growth expectations in the company. For example, a company with a low P/E ratio may not actually be a good value if it has little growth potential. Conversely, companies with high P/E ratios may be fairly valued in terms of growth expectations.
When we divide ACADIA Pharmaceuticals's P/E ratio by its projected 5 year earnings growth rate, we see that it has a Price to Earnings Growth (PEG) ratio of 0.24. This tells us that the company is largely undervalued in terms of growth expectations -- but remember, these growth expectations could turn out to be wrong!
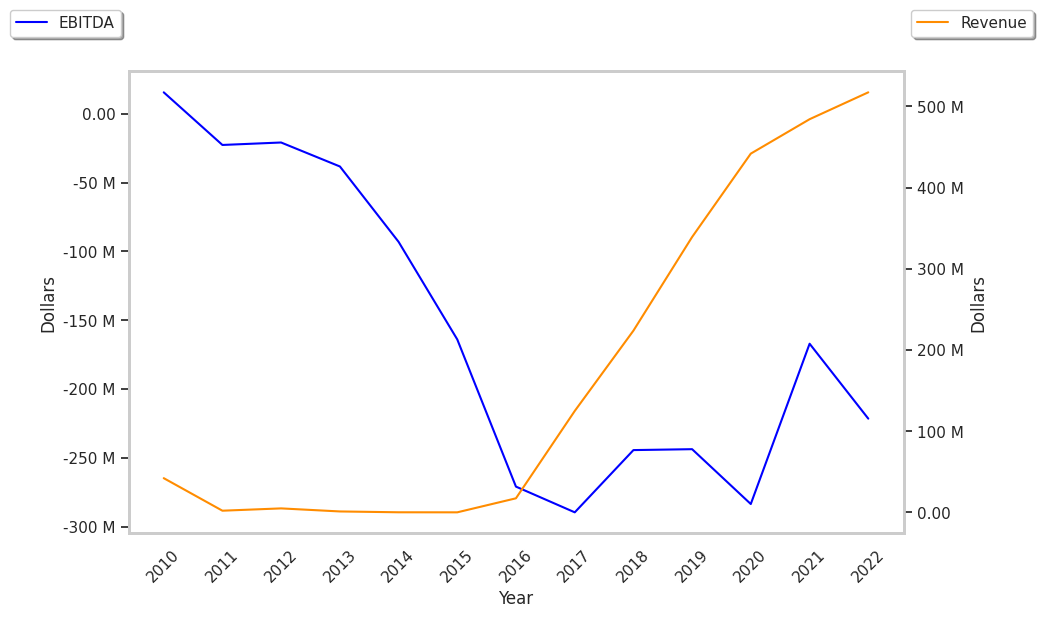
To understand the company's long term profitability and market position, we can analyze its operating margins, which are the ratio of its net profits to its revenues. Over the last four years, ACADIA Pharmaceuticals's operating margins have averaged -58.5% and displayed a mean growth rate of 22.3%. These numbers show that the company may not be on the best track.
To deepen our understanding of the company's finances, we should study the effect of its depreciation and capital expenditures on the company's bottom line. We can see the effect of these additional factors in ACADIA Pharmaceuticals's free cash flow, which was $-92591000 as of its most recent annual report. Free cash flow represents the amount of money available for reinvestment in the business or for payments to equity investors in the form of a dividend. In ACAD's case the cash flow outlook is weak. It's average cash flow over the last 4 years has been $-133165666.7 and they've been growing at an average rate of 8.5%.
Another valuation metric for analyzing a stock is its Price to Book (P/B) Ratio, which consists in its share price divided by its book value per share. The book value refers to the present liquidation value of the company, as if it sold all of its assets and paid off all debts). Acadia pharmaceuticals's P/B ratio is 12.78 -- in other words, the market value of the company exceeds its book value by a factor of more than 12, so the company's assets may be overvalued compared to the average P/B ratio of the Health Care sector, which stands at 4.08 as of the first quarter of 2023.
ACADIA Pharmaceuticals is likely overvalued at today's prices because it has a negative P/E ratio, an elevated P/B ratio, and negative cash flows with an upwards trend. The stock has poor growth indicators because of its consistently negative margins with a positive growth rate, and a negative PEG ratio. We hope this preliminary analysis will encourage you to do your own research into ACAD's fundamental values -- especially their trends over the last few years, which provide the clearest picture of the company's valuation.