Exxon Mobil returned losses of -13.5% last year, with its stock price reaching a high of $120.7 and a low of $95.77. Over the same period, the stock underperformed the S&P 500 index by -34.6%. As of April 2023, the company's 50-day average price was $101.29 and today it is trading at a price of $97.92 per share. Exxon Mobil Corporation engages in the exploration and production of crude oil and natural gas in the United States and internationally. Based in Spring, TX, the large-cap Energy company has 62,000 full time employees. Exxon Mobil has offered a 3.7% dividend yield over the last 12 months.
Strong Revenue Growth With no capital expenditures:
| 2018 | 2019 | 2020 | 2021 | 2022 | 2023 | |
|---|---|---|---|---|---|---|
| Revenue (MM) | $290,212 | $264,938 | $181,502 | $285,640 | $413,680 | $355,667 |
| Revenue Growth | n/a | -8.71% | -31.49% | 57.38% | 44.83% | -14.02% |
| Operating Margins | 11% | 8% | -16% | 11% | 19% | 17% |
| Net Margins | 7% | 5% | -12% | 8% | 13% | 12% |
| Net Income (MM) | $20,840 | $14,340 | -$22,440 | $23,040 | $55,740 | $41,130 |
| Net Interest Expense (MM) | $766 | $830 | $1,158 | $947 | $798 | $784 |
| Depreciation & Amort. (MM) | $18,745 | $18,998 | $46,009 | $20,607 | $24,040 | $17,965 |
| Earnings Per Share | $4.88 | $3.36 | -$5.25 | $5.39 | $13.26 | $10.07 |
| EPS Growth | n/a | -31.15% | -256.25% | 202.67% | 146.01% | -24.06% |
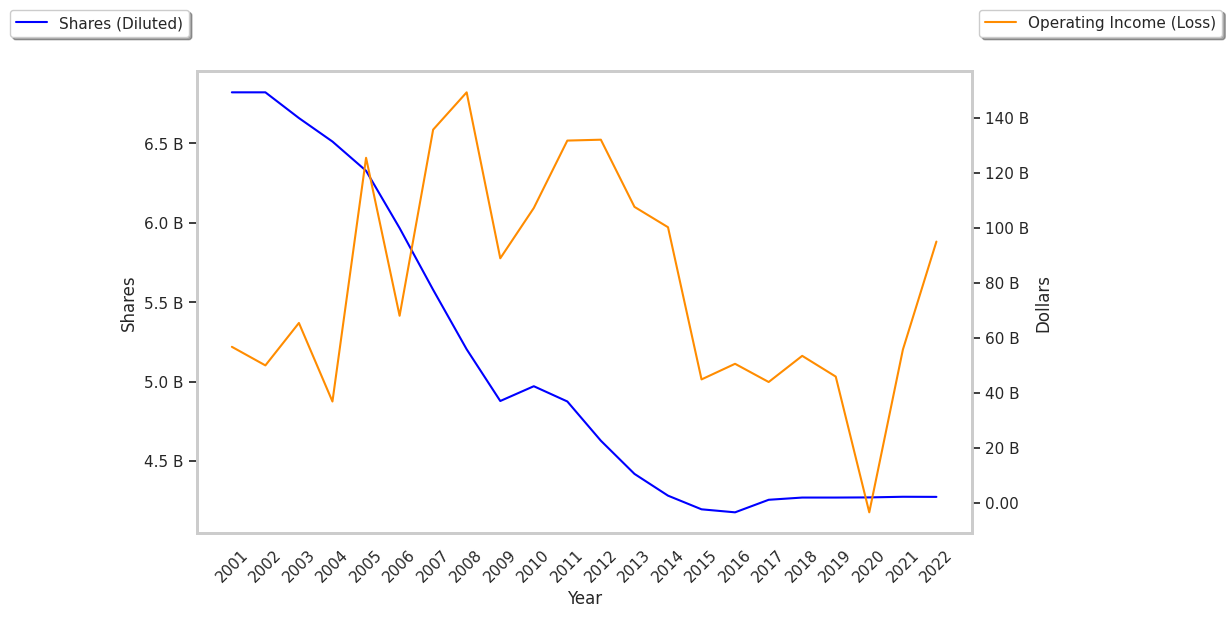
| Diluted Shares (MM) | 4,237 | 4,235 | 4,232 | 4,233 | 4,234 | 4,071 |
| Free Cash Flow (MM) | $16,440 | $5,355 | -$2,614 | $36,053 | $58,390 | $37,834 |
| Capital Expenditures (MM) | $19,574 | $24,361 | $17,282 | $12,076 | $18,407 | $21,474 |
| Current Ratio | 0.84 | 0.78 | 0.8 | 1.04 | 1.41 | 1.42 |
| Total Debt (MM) | $37,796 | $46,920 | $67,640 | $47,704 | $41,193 | $41,253 |
| Net Debt / EBITDA | 0.7 | 1.12 | 3.69 | 0.79 | 0.11 | 0.11 |
Exxon Mobil has generally positive cash flows, a strong EPS growth trend, and healthy leverage levels. Furthermore, Exxon Mobil has weak operating margins with a positive growth rate and just enough current assets to cover current liabilities.
Exxon Mobil's Valuation Is in Line With Its Sector Averages:
Exxon Mobil has a trailing twelve month P/E ratio of 10.1, compared to an average of 8.53 for the Energy sector. Based on its EPS guidance of $8.92, the company has a forward P/E ratio of 11.4. The 9.0% compound average growth rate of Exxon Mobil's historical and projected earnings per share yields a PEG ratio of 1.12. This implies that the shares are fairly valued. The market is placing a fair value on Exxon Mobil's equity, since its P/B ratio of 1.94 is comparable to its sector average of 1.78. The company's shares are currently trading -7.1% below their Graham number.
Exxon Mobil Has an Average Rating of Buy:
The 22 analysts following Exxon Mobil have set target prices ranging from $105.0 to $149.0 per share, for an average of $125.12 with a buy rating. As of April 2023, the company is trading -19.0% away from its average target price, indicating that there is an analyst consensus of strong upside potential.
Exxon Mobil has an average amount of shares sold short because 2.0% of the company's shares are sold short. Institutions own 60.5% of the company's shares, and the insider ownership rate stands at 0.06%, suggesting a small amount of insider investors. The largest shareholder is Vanguard Group Inc, whose 10% stake in the company is worth $37,919,924,370.