We've been asking ourselves recently if the market has placed a fair valuation on Occidental Petroleum. Let's dive into some of the fundamental values of this large-cap Energy company to determine if there might be an opportunity here for value-minded investors.
Trades Around Its Graham Number but Has an Elevated P/E Ratio:
Occidental Petroleum Corporation, together with its subsidiaries, engages in the acquisition, exploration, and development of oil and gas properties in the United States, the Middle East, North Africa, and Latin America. The company belongs to the Energy sector, which has an average price to earnings (P/E) ratio of 8.53 and an average price to book (P/B) ratio of 1.78. In contrast, Occidental Petroleum has a trailing 12 month P/E ratio of 12.5 and a P/B ratio of 2.39.
When we divide Occidental Petroleum's P/E ratio by its expected EPS growth rate of the next five years, we obtain its PEG ratio of -0.89. Since it's negative, the company has negative growth expectations, and most investors will probably avoid the stock unless it has an exceptionally low P/E and P/B ratio.
Strong Revenue Growth With a Flat Capital Expenditure Trend:
| 2018 | 2019 | 2020 | 2021 | 2022 | 2023 | |
|---|---|---|---|---|---|---|
| Revenue (MM) | $15,560 | $20,911 | $17,809 | $25,956 | $36,634 | $29,304 |
| Revenue Growth | n/a | 34.39% | -14.83% | 45.75% | 41.14% | -20.01% |
| Operating Margins | 34% | 2% | -88% | 14% | 39% | 25% |
| Net Margins | 27% | -5% | -83% | 9% | 36% | 19% |
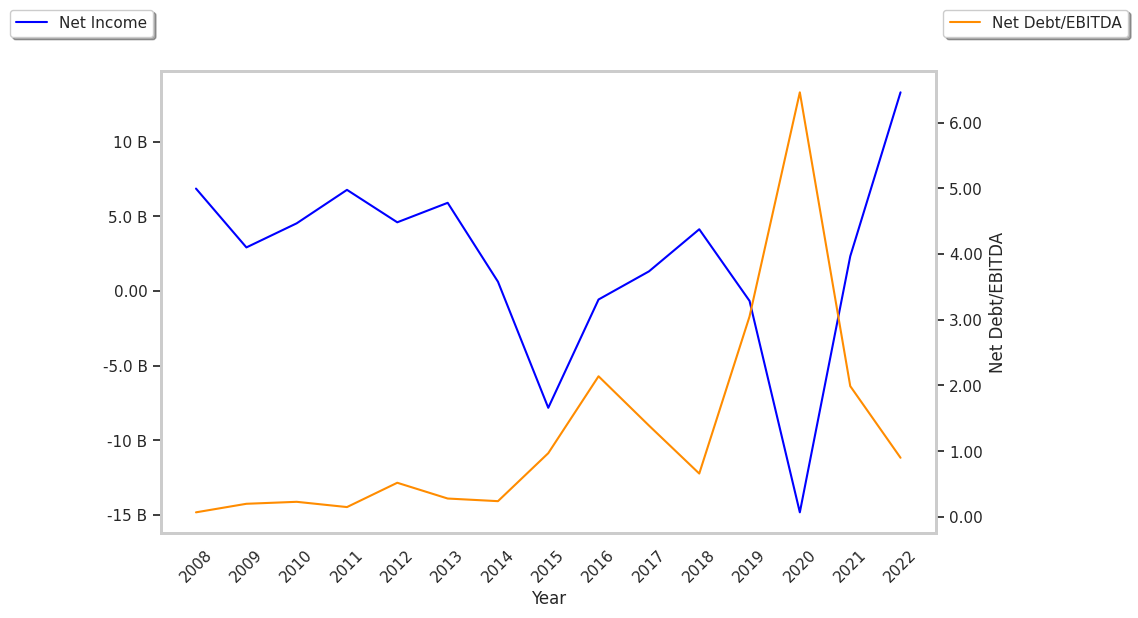
| Net Income (MM) | $4,131 | -$985 | -$14,831 | $2,322 | $13,304 | $5,425 |
| Net Interest Expense (MM) | $389 | $1,066 | $1,424 | $1,614 | $1,030 | $958 |
| Depreciation & Amort. (MM) | $3,977 | $6,140 | $8,097 | $8,447 | $6,926 | $6,961 |
| Earnings Per Share | $5.39 | -$1.22 | -$17.06 | $1.58 | $132.77 | $4.59 |
| EPS Growth | n/a | -122.63% | -1298.36% | 109.26% | 8303.16% | -96.54% |
| Diluted Shares (MM) | 763 | 810 | 919 | 959 | 100 | 958 |
| Free Cash Flow (MM) | $2,694 | $1,008 | $1,420 | $7,564 | $12,313 | $6,798 |
| Capital Expenditures (MM) | $4,975 | $6,367 | $2,535 | $2,870 | $4,497 | $6,246 |
| Current Ratio | 1.34 | 1.15 | 1.07 | 1.23 | 1.15 | 0.92 |
| Total Debt (MM) | $10,516 | $38,639 | $36,267 | $29,617 | $19,835 | $18,597 |
| Net Debt / EBITDA | 0.81 | 5.48 | -4.5 | 2.21 | 0.9 | 1.26 |
Occidental Petroleum has rapidly growing revenues and a flat capital expenditure trend, generally positive cash flows, and healthy leverage levels. However, the firm suffers from declining EPS growth and not enough current assets to cover current liabilities. Finally, we note that Occidental Petroleum has weak operating margins with a positive growth rate.