We've been asking ourselves recently if the market has placed a fair valuation on EOG Resources. Let's dive into some of the fundamental values of this large-cap Energy company to determine if there might be an opportunity here for value-minded investors.
EOG Resources's Valuation Is in Line With Its Sector Averages:
EOG Resources, Inc., together with its subsidiaries, explores for, develops, produces, and markets crude oil, and natural gas and natural gas liquids. The company belongs to the Energy sector, which has an average price to earnings (P/E) ratio of 8.53 and an average price to book (P/B) ratio of 1.78. In contrast, EOG Resources has a trailing 12 month P/E ratio of 8.3 and a P/B ratio of 2.35.
When we divide EOG Resources's P/E ratio by its expected EPS growth rate of the next five years, we obtain its PEG ratio of -9.54. Since it's negative, the company has negative growth expectations, and most investors will probably avoid the stock unless it has an exceptionally low P/E and P/B ratio.
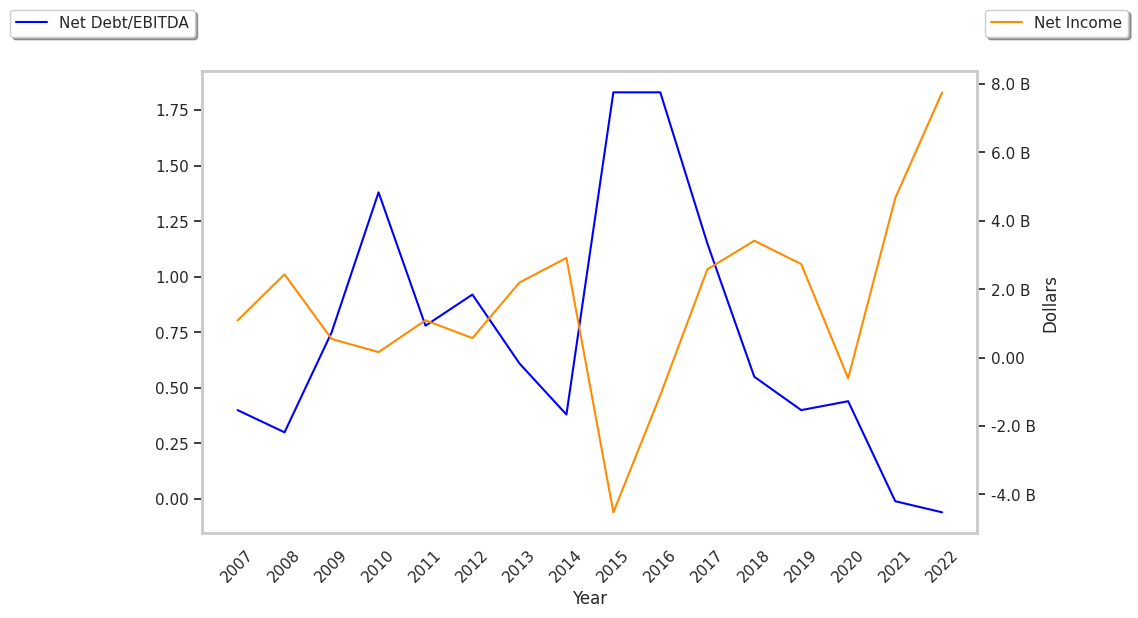
The Company Has Lacking Information on Debt Levels:
| 2018 | 2019 | 2020 | 2021 | 2022 | 2023 | |
|---|---|---|---|---|---|---|
| Revenue (MM) | $17,275 | $17,380 | $11,032 | $18,642 | $25,702 | $24,548 |
| Revenue Growth | n/a | 0.61% | -36.52% | 68.98% | 37.87% | -4.49% |
| Operating Margins | 26% | 21% | -5% | 33% | 39% | 41% |
| Net Margins | 20% | 16% | -5% | 25% | 30% | 32% |
| Net Income (MM) | $3,419 | $2,735 | -$605 | $4,664 | $7,759 | $7,883 |
| Net Interest Expense (MM) | $17 | $31 | $10 | $178 | $179 | $155 |
| Depreciation & Amort. (MM) | $3,435 | $3,750 | $3,400 | $3,651 | $3,542 | $3,440 |
| Earnings Per Share | $5.89 | $4.71 | -$1.04 | $7.99 | $13.22 | $13.47 |
| EPS Growth | n/a | -20.03% | -122.08% | 868.27% | 65.46% | 1.89% |
| Diluted Shares (MM) | 580 | 581 | 581 | 584 | 587 | 583 |
| Free Cash Flow (MM) | $7,531 | $7,893 | $4,787 | $8,579 | $10,712 | $10,909 |
| Capital Expenditures (MM) | $237 | $270 | $221 | $212 | $381 | $771 |
| Current Ratio | 1.36 | 1.18 | 1.69 | 2.12 | 1.9 | 2.43 |
EOG Resources has rapidly growing revenues and increasing reinvestment in the business and generally positive cash flows. Additionally, the company's financial statements display an excellent current ratio of 2.43 and a strong EPS growth trend.