We've been asking ourselves recently if the market has placed a fair valuation on LPL Financial. Let's dive into some of the fundamental values of this large-cap Finance company to determine if there might be an opportunity here for value-minded investors.
Trades Below Its Graham Number but Has an Elevated P/B Ratio:
LPL Financial Holdings Inc., together with its subsidiaries, provides an integrated platform of brokerage and investment advisory services to independent financial advisors and financial advisors at enterprises in the United States. The company belongs to the Finance sector, which has an average price to earnings (P/E) ratio of 12.38 and an average price to book (P/B) ratio of 1.58. In contrast, LPL Financial has a trailing 12 month P/E ratio of 18.9 and a P/B ratio of 9.29.
When we divideLPL Financial's P/E ratio by its expected five-year EPS growth rate, we obtain a PEG ratio of 0.9, which indicates that the market is undervaluing the company's projected growth (a PEG ratio of 1 indicates a fairly valued company). Your analysis of the stock shouldn't end here. Rather, a good PEG ratio should alert you that it may be worthwhile to take a closer look at the stock.
Strong Revenue Growth With Increasing Reinvestment in the Business:
| 2018 | 2019 | 2020 | 2021 | 2022 | 2023 | |
|---|---|---|---|---|---|---|
| Revenue (MM) | $5,188 | $5,625 | $5,872 | $7,721 | $8,601 | $9,742 |
| Revenue Growth | n/a | 8.41% | 4.39% | 31.49% | 11.4% | 13.27% |
| Interest Income (MM) | $40 | $47 | $29 | $104 | $126 | $169 |
| Operating Margins | 11% | 13% | 11% | 8% | 13% | 16% |
| Net Margins | 8% | 10% | 8% | 6% | 10% | 12% |
| Net Income (MM) | $439 | $560 | $473 | $460 | $846 | $1,168 |
| Depreciation & Amort. (MM) | $88 | $96 | $110 | $151 | $200 | $200 |
| Earnings Per Share | $4.85 | $6.62 | $5.86 | $5.63 | $10.4 | $14.73 |
| EPS Growth | n/a | 36.49% | -11.48% | -3.92% | 84.72% | 41.63% |
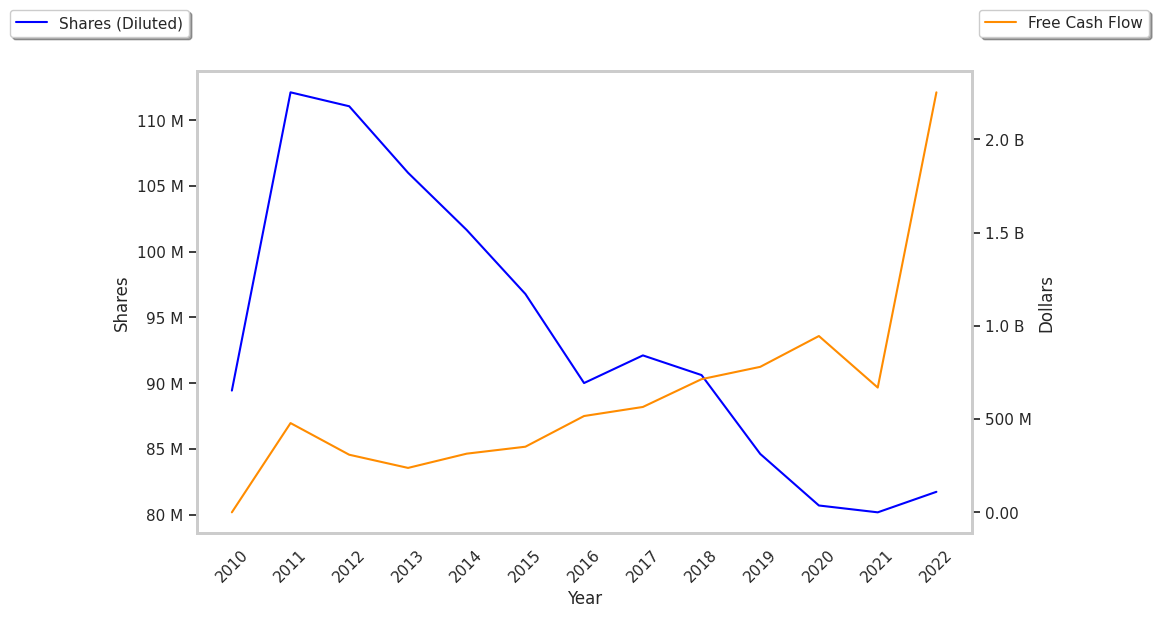
| Diluted Shares (MM) | 91 | 85 | 81 | 82 | 81 | 77 |
| Free Cash Flow (MM) | $449 | $467 | $634 | $237 | $1,639 | -$178 |
| Capital Expenditures (MM) | $133 | $156 | $156 | $216 | $307 | $372 |
| Total Debt (MM) | $2,372 | $2,399 | $2,345 | $2,814 | $2,717 | $3,124 |
| Net Debt / EBITDA | 2.74 | 2.16 | 2.09 | 3.08 | 1.43 | 1.31 |
LPL Financial has rapidly growing revenues and increasing reinvestment in the business and strong operating margins with a positive growth rate. Additionally, the company's financial statements display exceptional EPS growth and low leverage levels. However, the firm has positive cash flows.