AT&T logged a 2.7% change during today's morning session, and is now trading at a price of $17.26 per share.
AT&T returned losses of -10.2% last year, with its stock price reaching a high of $19.99 and a low of $13.43. Over the same period, the stock underperformed the S&P 500 index by -38.9%. AThe company's 50-day average price was $16.96. AT&T Inc. provides telecommunications and technology services worldwide. Based in Dallas, TX, the Large-Cap Telecommunications company has 149,900 full time employees. AT&T has not offered a dividend during the last year.
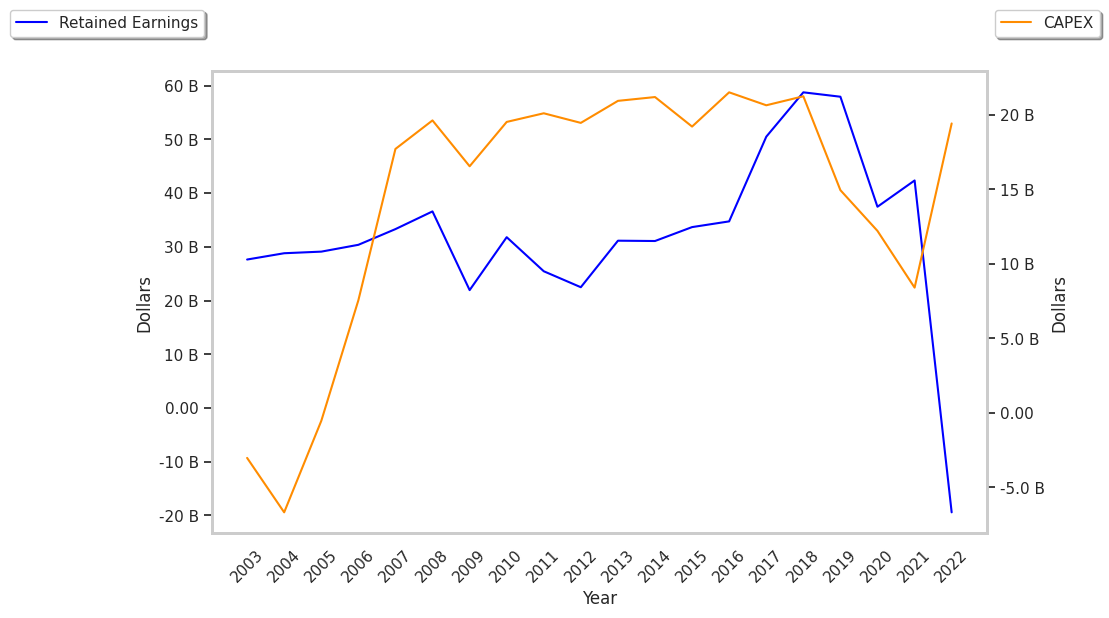
The Company's Revenues Are Declining:
| 2018 | 2019 | 2020 | 2021 | 2022 | 2023 | |
|---|---|---|---|---|---|---|
| Revenue (M) | $170,756 | $181,193 | $143,050 | $134,038 | $120,741 | $121,749 |
| Operating Margins | 15% | 15% | 6% | 19% | -4% | -2% |
| Net Margins | 11% | 8% | -4% | 15% | -7% | -9% |
| Net Income (M) | $19,370 | $13,903 | -$5,176 | $20,081 | -$8,524 | -$11,305 |
| Net Interest Expense (M) | $7,957 | $8,422 | $7,727 | $6,716 | $6,108 | $6,538 |
| Depreciation & Amort. (M) | $28,430 | $28,217 | $22,523 | $17,852 | $18,021 | $18,606 |
| Diluted Shares (M) | 6,806 | 7,348 | 7,466 | 7,503 | 7,587 | 7,185 |
| Earnings Per Share | $2.85 | $1.89 | -$0.75 | $2.73 | -$1.13 | -$1.48 |
| EPS Growth | n/a | -33.68% | -139.68% | 464.0% | -141.39% | -30.97% |
| Avg. Price | $17.99 | $19.55 | $18.98 | $18.35 | $17.72 | $17.13 |
| P/E Ratio | 6.31 | 10.29 | -25.31 | 6.62 | -15.68 | -11.27 |
| CAPEX (M) | $21,251 | $19,635 | $14,690 | $15,545 | $19,626 | $17,481 |
| EV / EBITDA | 5.17 | 5.27 | 9.24 | 6.57 | 19.26 | 16.08 |
| Total Debt (M) | $176,505 | $163,147 | $157,245 | $175,631 | $135,890 | $138,003 |
| Net Debt / EBITDA | 3.14 | 2.73 | 4.83 | 3.58 | 9.84 | 8.31 |
| Current Ratio | 0.8 | 0.79 | 0.82 | 1.61 | 0.59 | 0.69 |
AT&T's financial statements include several red flags such as declining revenues and decreasing reinvestment in the business, declining EPS growth, and not enough current assets to cover current liabilities because its current ratio is 0.69. Additionally, the firm has a highly leveraged balance sheet.
AT&T Has Attractive P/B and P/E Ratios:
AT&T has a trailing twelve month P/E ratio of 8.7, compared to an average of 23.78 for the Telecommunications sector. Based on its EPS guidance of $2.3, the company has a forward P/E ratio of 7.4. The -3.0% compound average growth rate of AT&T's historical and projected earnings per share yields a PEG ratio of -2.88. This indicates that its shares are overvalued.In contrast, the market is likely undervaluing AT&T in terms of its equity because its P/B ratio is 1.19 while the sector average is 3.46.
AT&T Has an Analyst Consensus of Some Upside Potential:
The 22 analysts following AT&T have set target prices ranging from $11.0 to $29.0 per share, for an average of $19.35 with a buy rating. The company is trading -10.8% away from its average target price, indicating that there is an analyst consensus of some upside potential.
AT&T has a very low short interest because 1.3% of the company's shares are sold short. Institutions own 58.6% of the company's shares, and the insider ownership rate stands at 0.07%, suggesting a small amount of insider investors. The largest shareholder is Vanguard Group Inc, whose 9% stake in the company is worth $10,742,669,495.