Freeport-McMoRan shares fell by -2.0% during the day's afternoon session, and are now trading at a price of $45.33. Is it time to buy the dip? To better answer that question, it's essential to check if the market is valuing the company's shares fairly in terms of its earnings and equity levels.
Freeport-McMoRan's Valuation Is in Line With Its Sector Averages:
Freeport-McMoRan Inc. engages in the mining of mineral properties in North America, South America, and Indonesia. The company belongs to the Basic Materials sector, which has an average price to earnings (P/E) ratio of 16.53 and an average price to book (P/B) ratio of 2.07. In contrast, Freeport-McMoRan has a trailing 12 month P/E ratio of 35.4 and a P/B ratio of 3.9.
When we divide Freeport-McMoRan's P/E ratio by its expected EPS growth rate of the next five years, we obtain its PEG ratio of -27.01. Since it's negative, the company has negative growth expectations, and most investors will probably avoid the stock unless it has an exceptionally low P/E and P/B ratio.
Strong Revenue Growth and Healthy Leverage Levels:
| 2018 | 2019 | 2020 | 2021 | 2022 | 2023 | |
|---|---|---|---|---|---|---|
| Revenue (M) | $18,628 | $14,402 | $14,198 | $22,845 | $22,780 | $22,708 |
| Operating Margins | 26% | 8% | 17% | 37% | 31% | 27% |
| Net Margins | 16% | -1% | 6% | 23% | 20% | 16% |
| Net Income (M) | $2,894 | -$189 | $865 | $5,365 | $4,479 | $3,721 |
| Net Interest Expense (M) | -$945 | -$620 | -$598 | -$602 | -$560 | -$555 |
| Depreciation & Amort. (M) | $1,754 | $1,412 | $1,528 | $1,998 | $2,019 | $1,994 |
| Diluted Shares (M) | 1,457 | 1,457 | 1,461 | 1,482 | 1,451 | 1,443 |
| Earnings Per Share | $1.78 | -$0.17 | $0.41 | $2.9 | $3.09 | $2.58 |
| EPS Growth | n/a | -109.55% | 341.18% | 607.32% | 6.55% | -16.5% |
| Avg. Price | $14.82 | $10.84 | $13.42 | $35.42 | $40.96 | $45.4917 |
| CAPEX (M) | $1,971 | $2,652 | $1,961 | $2,115 | $3,469 | $4,509 |
| EV / EBITDA | 4.36 | 13.32 | 8.88 | 5.99 | 7.91 | 8.56 |
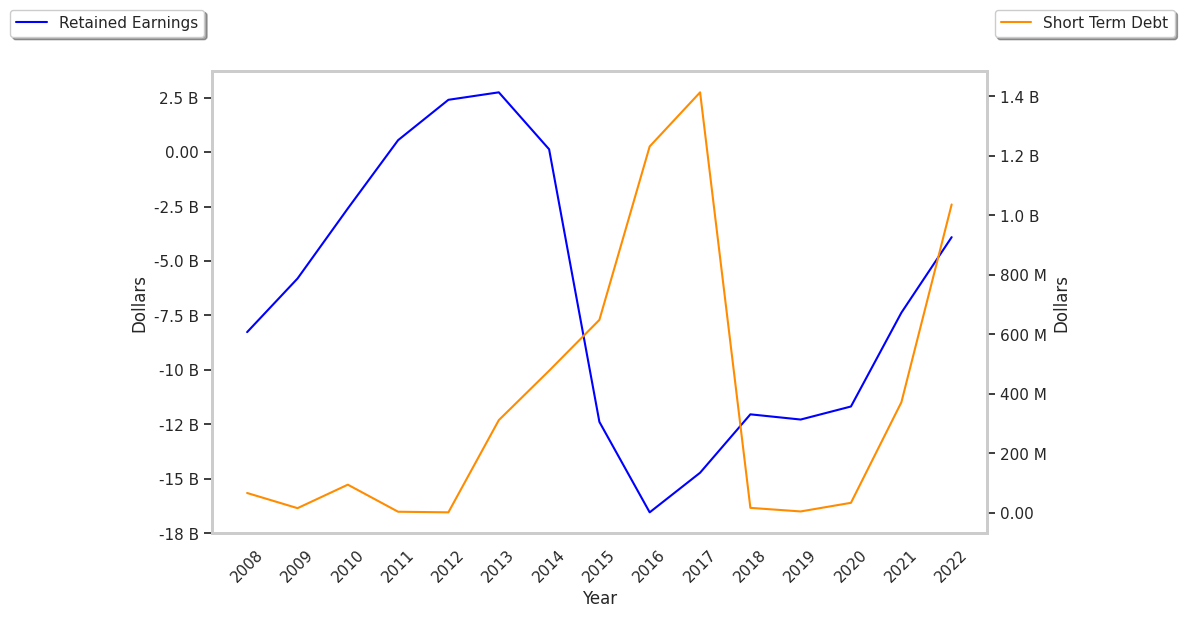
| Total Debt (M) | $11,128 | $19,647 | $19,388 | $18,528 | $20,203 | $9,405 |
| Net Debt / EBITDA | 1.06 | 7.04 | 3.97 | 1.01 | 1.33 | 0.46 |
| Current Ratio | 3.14 | 2.47 | 2.72 | 2.52 | 2.46 | 2.9 |
Freeport-McMoRan benefits from rapidly growing revenues and increasing reinvestment in the business, an excellent current ratio of 2.9, and decent operating margins with a positive growth rate. The company's financial statements show positive EPS growth and healthy leverage levels.