Enterprise Products logged a 1.3% change during today's afternoon session, and is now trading at a price of $29.77 per share.
Enterprise Products returned gains of 12.3% last year, with its stock price reaching a high of $29.84 and a low of $25.19. Over the same period, the stock underperformed the S&P 500 index by -15.6%. The company's 50-day average price was $27.7. Enterprise Products Partners L.P. provides midstream energy services to producers and consumers of natural gas, natural gas liquids (NGLs), crude oil, petrochemicals, and refined products. The Large-Cap Utilities company is based in Houston, TX. Enterprise Products has offered a 6.8% dividend yield over the last 12 months.
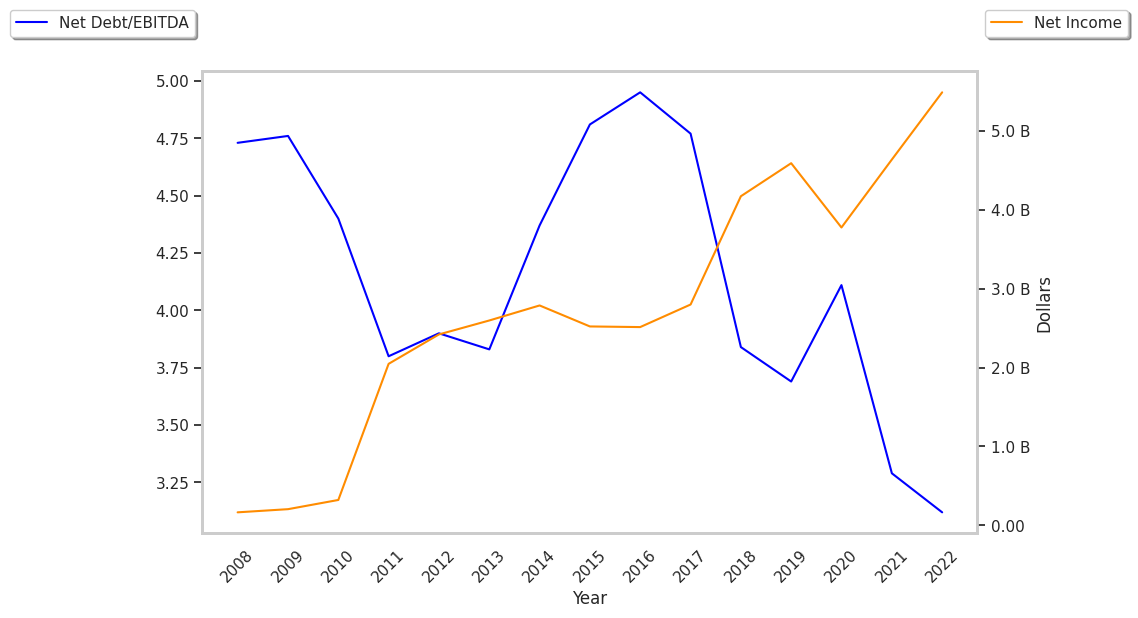
A Positive EPS Growth Rate at the Expense of a Highly Leveraged Balance Sheet:
| 2018 | 2019 | 2020 | 2021 | 2022 | 2023 | |
|---|---|---|---|---|---|---|
| Revenue (M) | $36,534 | $32,789 | $27,200 | $40,807 | $58,186 | $49,715 |
| Operating Margins | 15% | 19% | 19% | 15% | 12% | 14% |
| Net Margins | 11% | 14% | 14% | 11% | 9% | 11% |
| Net Income (M) | $4,172 | $4,591 | $3,775 | $4,634 | $5,487 | $5,529 |
| Net Interest Expense (M) | $1,097 | $1,243 | $1,287 | $1,283 | $1,244 | $1,269 |
| Depreciation & Amort. (M) | $1,792 | $1,949 | $2,072 | $151 | $177 | $201 |
| Diluted Shares (M) | 2,187 | 2,202 | 2,202 | 2,203 | 2,199 | 2,194 |
| Earnings Per Share | $1.91 | $2.09 | $1.71 | $2.1 | $2.5 | $2.52 |
| EPS Growth | n/a | 9.42% | -18.18% | 22.81% | 19.05% | 0.8% |
| Avg. Price | $18.89 | $20.7 | $15.22 | $19.63 | $23.14 | $29.785 |
| P/E Ratio | 9.79 | 9.86 | 8.85 | 9.26 | 9.18 | 11.68 |
| CAPEX (M) | $4,223 | $4,532 | $3,288 | $2,223 | $1,964 | $3,266 |
| EV / EBITDA | 9.26 | 9.03 | 8.74 | 11.12 | 11.09 | 13.08 |
| Total Debt (M) | $26,178 | $27,625 | $29,866 | $29,535 | $28,295 | $28,748 |
| Net Debt / EBITDA | 3.59 | 3.4 | 4.05 | 4.27 | 3.98 | 4.01 |
| Current Ratio | 0.85 | 0.86 | 1.1 | 1.14 | 0.86 | 0.93 |
Enterprise Products Is Too Expensive at Current Levels:
Enterprise Products has a trailing twelve month P/E ratio of 11.0, compared to an average of 17.53 for the Utilities sector. Based on its EPS guidance of $2.82, the company has a forward P/E ratio of 9.8. The 5.7% compound average growth rate of Enterprise Products's historical and projected earnings per share yields a PEG ratio of 1.92. This suggests that these shares are overvalued. Furthermore, Enterprise Products is likely overvalued compared to the book value of its equity, since its P/B ratio of 2.33 is higher than the sector average of 1.71. The company's shares are currently trading -10.2% below their Graham number.
Analysts Give Enterprise Products an Average Rating of Buy:
The 18 analysts following Enterprise Products have set target prices ranging from $29.0 to $36.0 per share, for an average of $32.33 with a buy rating. The company is trading -7.9% away from its average target price, indicating that there is an analyst consensus of some upside potential.
Enterprise Products has a very low short interest because 1.2% of the company's shares are sold short. Institutions own 26.4% of the company's shares, and the insider ownership rate stands at 32.81%, suggesting a large amount of insider shareholders. The largest shareholder is Alps Advisors Inc., whose 2% stake in the company is worth $1,053,150,298.