NetEase logged a -1.4% change during today's morning session, and is now trading at a price of $98.12 per share.
NetEase returned gains of 10.5% last year, with its stock price reaching a high of $118.9 and a low of $80.79. Over the same period, the stock underperformed the S&P 500 index by -14.0%. The company's 50-day average price was $104.78. NetEase, Inc. engages in online games, music streaming, online intelligent learning services, and internet content services businesses in China and internationally . The Large-Cap Technology company is headquartered in Hangzhou, China. NetEase has offered a 18.3% dividend yield over the last 12 months.
Strong Revenue Growth but Slimmer Gross Margins to the Industry Average of 70.92%:
| 2017 | 2018 | 2019 | 2020 | 2021 | 2022 | |
|---|---|---|---|---|---|---|
| Revenue (M) | $6,556 | $9,768 | $8,509 | $11,290 | $13,747 | $13,991 |
| Gross Margins | 61% | 42% | 53% | 53% | 54% | 55% |
| Net Margins | 25% | 10% | 36% | 17% | 19% | 21% |
| Net Income (M) | $1,667 | $942 | $3,078 | $1,890 | $2,664 | $2,877 |
| Net Interest Expense (M) | $43 | $87 | $63 | $113 | $111 | $123 |
| Depreciation & Amort. (M) | $123 | $303 | $375 | $530 | $514 | $414 |
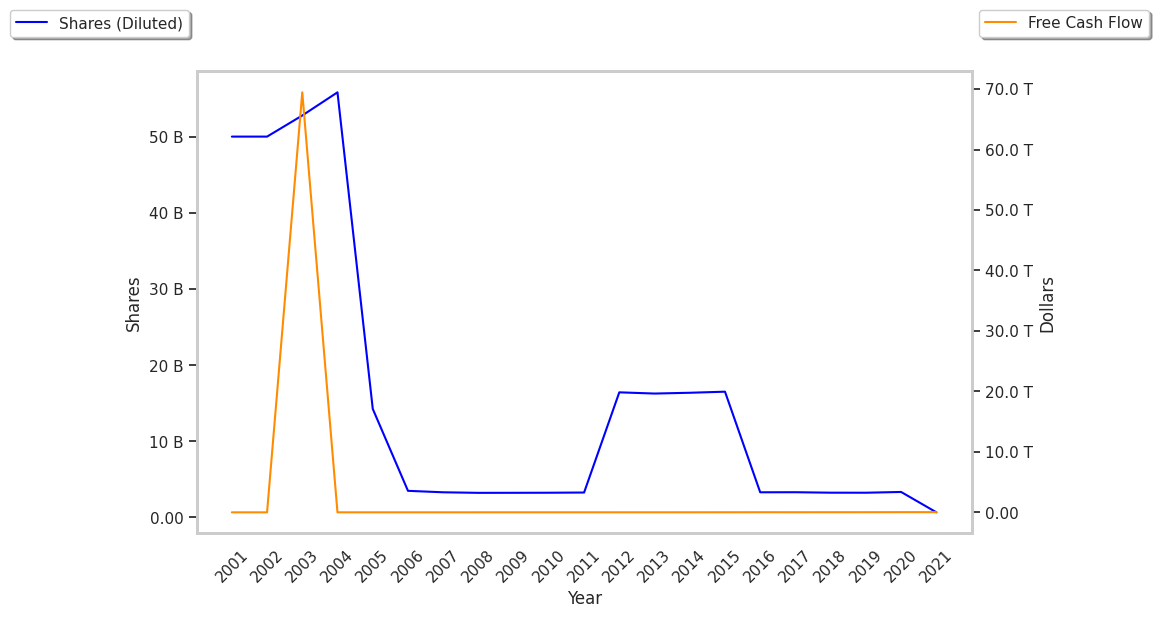
| Diluted Shares (M) | 3,315 | 3,255 | 3,250 | 3,350 | 3,367 | 3,296 |
| Earnings Per Share | $0.5 | $0.27 | $0.94 | $2.75 | $0.79 | $0.89 |
| EPS Growth | n/a | -46.0% | 248.15% | 192.55% | -71.27% | 12.66% |
| Avg. Price | $54.89 | $47.05 | $48.95 | $78.16 | $101.44 | $92.85 |
| P/E Ratio | 109.78 | 168.04 | 51.53 | 27.91 | 126.8 | 103.17 |
| Free Cash Flow (M) | $1,544 | $1,584 | $2,299 | $3,653 | $3,660 | $3,713 |
| CAPEX (M) | $283 | $368 | $174 | $162 | $251 | $305 |
| Current Ratio | 2.61 | 1.96 | 2.23 | 2.31 | 2.24 | 2.32 |
NetEase has rapidly growing revenues and a flat capital expenditure trend and generally positive cash flows. Additionally, the company's financial statements display an excellent current ratio of 2.32 and a strong EPS growth trend. However, the firm has slimmer gross margins than its peers.
an Exceptionally Low P/B Ratio but Trades Above Its Graham Number:
NetEase has a trailing twelve month P/E ratio of 16.7, compared to an average of 35.0 for the Technology sector. Based on its EPS guidance of $7.95, the company has a forward P/E ratio of 13.2. According to the 48.5% compound average growth rate of NetEase's historical and projected earnings per share, the company's PEG ratio is 0.35. Taking the weighted average of the company's EPS CAGR and the broader market's 5-year projected EPS growth rate, we obtain a normalized growth rate of 20.9%. On this basis, the company's PEG ratio is 0.8. This suggests that its shares are undervalued. Additionally, the market is possibly undervaluing NetEase in terms of its equity because its P/B ratio is 0.51 whereas the sector average is 7.92. The company's shares are currently trading 922.1% below their Graham number.
NetEase Has an Average Rating of Buy:
The 27 analysts following NetEase have set target prices ranging from $115.0 to $150.01 per share, for an average of $135.52 with a buy rating. The company is trading -27.6% away from its average target price, indicating that there is an analyst consensus of strong upside potential.
The largest shareholder is Ubs Asset Management Americas Inc, whose 1% stake in the company is worth $671,966,792.