It hasn't been a great afternoon session for NetEase investors, who have watched their shares sink by -5.1% to a price of $92.15. Some of you might be wondering if it's time to buy the dip. If you are considering this, make sure to check the company's fundamentals first to determine if the shares are fairly valued at today's prices.
an Exceptionally Low P/B Ratio but Trades Above Its Graham Number:
NetEase, Inc. engages in online games, music streaming, online intelligent learning services, and internet content services businesses in China and internationally . The company belongs to the Technology sector, which has an average price to earnings (P/E) ratio of 35.0 and an average price to book (P/B) ratio of 7.92. In contrast, NetEase has a trailing 12 month P/E ratio of 14.7 and a P/B ratio of 0.48.
NetEase's PEG ratio is 37.89, which shows that the stock is probably overvalued in terms of its estimated growth. For reference, a PEG ratio near or below 1 is a potential signal that a company is undervalued.
Strong Revenue Growth but Slimmer Gross Margins to the Industry Average of 70.92%:
| 2017 | 2018 | 2019 | 2020 | 2021 | 2022 | |
|---|---|---|---|---|---|---|
| Revenue (M) | $6,556 | $9,768 | $8,509 | $11,290 | $13,747 | $13,991 |
| Gross Margins | 61% | 42% | 53% | 53% | 54% | 55% |
| Net Margins | 25% | 10% | 36% | 17% | 19% | 21% |
| Net Income (M) | $1,667 | $942 | $3,078 | $1,890 | $2,664 | $2,877 |
| Net Interest Expense (M) | $43 | $87 | $63 | $113 | $111 | $123 |
| Depreciation & Amort. (M) | $123 | $303 | $375 | $530 | $514 | $414 |
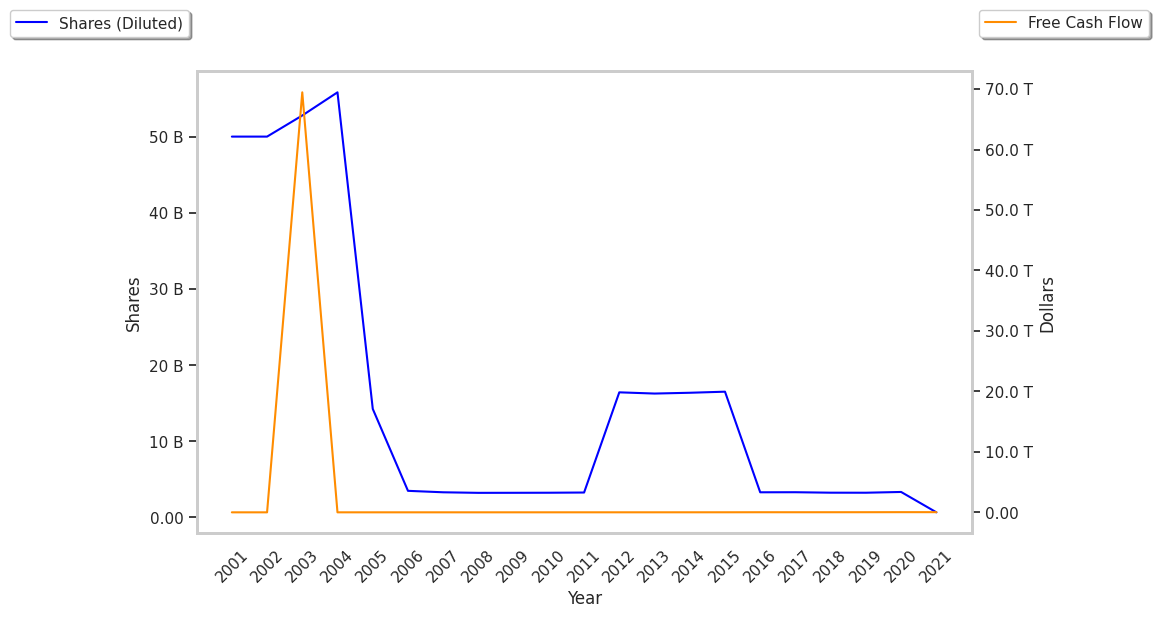
| Diluted Shares (M) | 3,315 | 3,255 | 3,250 | 3,350 | 3,367 | 3,296 |
| Earnings Per Share | $0.5 | $0.27 | $0.94 | $2.75 | $0.79 | $0.89 |
| EPS Growth | n/a | -46.0% | 248.15% | 192.55% | -71.27% | 12.66% |
| Avg. Price | $54.89 | $47.05 | $48.95 | $78.16 | $101.44 | $92.85 |
| P/E Ratio | 109.78 | 168.04 | 51.53 | 27.91 | 126.8 | 103.17 |
| Free Cash Flow (M) | $1,544 | $1,584 | $2,299 | $3,653 | $3,660 | $3,713 |
| CAPEX (M) | $283 | $368 | $174 | $162 | $251 | $305 |
| Current Ratio | 2.61 | 1.96 | 2.23 | 2.31 | 2.24 | 2.32 |
NetEase has rapidly growing revenues and a flat capital expenditure trend and generally positive cash flows. Additionally, the company's financial statements display an excellent current ratio of 2.32 and a strong EPS growth trend. However, the firm has slimmer gross margins than its peers.