ConocoPhillips shares fell by -1.4% during the day's afternoon session, and are now trading at a price of $122.66. Is it time to buy the dip? To better answer that question, it's essential to check if the market is valuing the company's shares fairly in terms of its earnings and equity levels.
ConocoPhillips's Valuation Is in Line With Its Sector Averages:
ConocoPhillips explores for, produces, transports, and markets crude oil, bitumen, natural gas, liquefied natural gas (LNG), and natural gas liquids in the United States, Canada, China, Libya, Malaysia, Norway, the United Kingdom, and internationally. The company belongs to the Energy sector, which has an average price to earnings (P/E) ratio of 8.53 and an average price to book (P/B) ratio of 1.78. In contrast, ConocoPhillips has a trailing 12 month P/E ratio of 13.5 and a P/B ratio of 2.93.
ConocoPhillips's PEG ratio is 2.19, which shows that the stock is probably overvalued in terms of its estimated growth. For reference, a PEG ratio near or below 1 is a potential signal that a company is undervalued.
Growing Revenues but an Average Current Ratio:
| 2018 | 2019 | 2020 | 2021 | 2022 | 2023 | |
|---|---|---|---|---|---|---|
| Revenue (M) | $38,727 | $36,670 | $18,784 | $45,828 | $78,494 | $56,141 |
| Operating Margins | 26% | 26% | -17% | 28% | 36% | 28% |
| Net Margins | 16% | 20% | -14% | 18% | 24% | 20% |
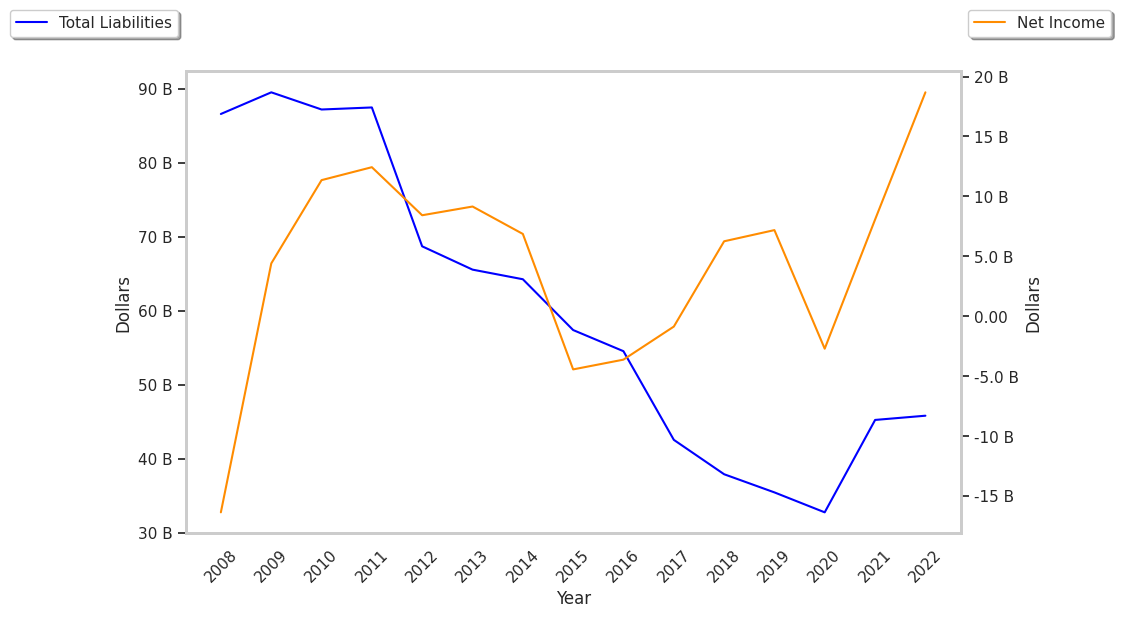
| Net Income (M) | $6,257 | $7,189 | -$2,701 | $8,079 | $18,680 | $10,957 |
| Net Interest Expense (M) | $735 | $778 | $806 | $884 | $805 | $780 |
| Depreciation & Amort. (M) | $5,956 | $6,090 | $5,521 | $7,208 | $7,504 | $8,270 |
| Diluted Shares (M) | 1,176 | 1,124 | 1,078 | 1,328 | 1,278 | 1,206 |
| Earnings Per Share | $5.32 | $6.4 | -$2.51 | $6.07 | $14.57 | $9.06 |
| EPS Growth | n/a | 20.3% | -139.22% | 341.83% | 140.03% | -37.82% |
| Avg. Price | $55.48 | $52.48 | $36.6 | $54.29 | $91.26 | $122.505 |
| P/E Ratio | 10.35 | 8.16 | -14.58 | 8.91 | 6.24 | 13.49 |
| Free Cash Flow (M) | $6,184 | $4,468 | $87 | $11,672 | $18,155 | $8,717 |
| CAPEX (M) | $6,750 | $6,636 | $4,715 | $5,324 | $10,159 | $11,248 |
| EV / EBITDA | 4.66 | 4.44 | 21.82 | 4.44 | 3.6 | 6.62 |
| Total Debt (M) | $14,968 | $14,895 | $15,369 | $19,934 | $16,643 | $18,937 |
| Net Debt / EBITDA | 0.57 | 0.63 | 5.2 | 0.75 | 0.29 | 0.54 |
| Current Ratio | 1.79 | 2.4 | 2.25 | 1.34 | 1.46 | 1.43 |
ConocoPhillips benefits from growing revenues and increasing reinvestment in the business, strong operating margins with a stable trend, and generally positive cash flows. The company's financial statements show positive EPS growth and healthy leverage levels. Furthermore, ConocoPhillips has just enough current assets to cover current liabilities, as shown by its current ratio of 1.43.