Now trading at a price of $163.34, Nucor has moved 1.0% so far today.
Nucor returned gains of 10.1% last year, with its stock price reaching a high of $203.0 and a low of $140.07. Over the same period, the stock underperformed the S&P 500 index by -14.6%. The company's 50-day average price was $180.7. Nucor Corporation engages in manufacture and sale of steel and steel products. Based in Charlotte, NC, the Large-Cap Industrials company has 32,000 full time employees. Nucor has offered a 1.3% dividend yield over the last 12 months.
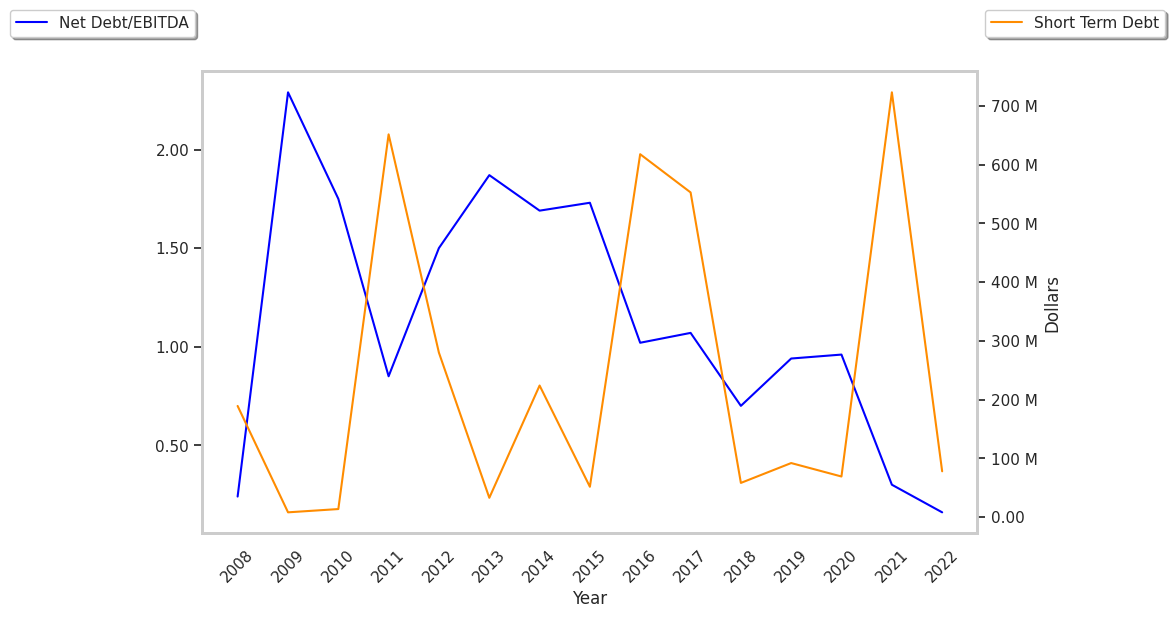
Growing Revenues and Healthy Leverage Levels:
| 2018 | 2019 | 2020 | 2021 | 2022 | 2023 | |
|---|---|---|---|---|---|---|
| Revenue (M) | $25,067 | $22,589 | $20,140 | $36,484 | $41,512 | $34,714 |
| Operating Margins | 13% | 8% | 4% | 25% | 25% | 18% |
| Net Margins | 9% | 6% | 4% | 19% | 18% | 13% |
| Net Income (M) | $2,361 | $1,271 | $721 | $6,827 | $7,607 | $4,525 |
| Net Interest Expense (M) | $161 | $157 | $167 | $163 | $219 | $246 |
| Depreciation & Amort. (M) | $631 | $649 | $702 | $735 | $827 | $931 |
| Diluted Shares (M) | 317 | 306 | 303 | 293 | 263 | 250 |
| Earnings Per Share | $7.42 | $4.14 | $2.36 | $23.16 | $28.79 | $18.0 |
| EPS Growth | n/a | -44.2% | -43.0% | 881.36% | 24.31% | -37.48% |
| Avg. Price | $55.85 | $49.95 | $42.51 | $89.84 | $125.5 | $163.34 |
| P/E Ratio | 7.51 | 12.07 | 17.94 | 3.87 | 4.35 | 9.05 |
| Free Cash Flow (M) | $1,411 | $1,332 | $1,154 | $4,609 | $8,124 | $4,898 |
| CAPEX (M) | $983 | $1,477 | $1,543 | $1,622 | $1,948 | $2,214 |
| EV / EBITDA | 5.35 | 7.42 | 10.04 | 3.02 | 3.26 | 5.76 |
| Total Debt (M) | $4,291 | $4,321 | $5,283 | $5,577 | $6,642 | $6,723 |
| Net Debt / EBITDA | 0.75 | 1.15 | 1.72 | 0.32 | 0.21 | 0.05 |
| Current Ratio | 3.08 | 3.34 | 3.61 | 2.48 | 3.39 | 3.57 |
Nucor has growing revenues and increasing reinvestment in the business, strong operating margins with a positive growth rate, and generally positive cash flows. The company also benefits from an excellent current ratio of 3.57, a strong EPS growth trend, and healthy leverage levels.
The Market May Be Undervaluing Nucor's Assets and Equity:
Nucor has a trailing twelve month P/E ratio of 10.6, compared to an average of 25.4 for the Industrials sector. Based on its EPS guidance of $12.19, the company has a forward P/E ratio of 14.8. The 7.3% compound average growth rate of Nucor's historical and projected earnings per share yields a PEG ratio of 1.45. This implies that the shares are fairly valued. Additionally, the market is possibly undervaluing Nucor in terms of its equity because its P/B ratio is 1.89 whereas the sector average is 3.23. The company's shares are currently trading -11.2% above their Graham number.
There's an Analyst Consensus of Some Upside Potential for Nucor:
The 10 analysts following Nucor have set target prices ranging from $39.0 to $240.0 per share, for an average of $189.86 with a buy rating. The company is trading -14.0% away from its average target price, indicating that there is an analyst consensus of some upside potential.
Nucor has an average amount of shares sold short because 3.0% of the company's shares are sold short. Institutions own 79.8% of the company's shares, and the insider ownership rate stands at 0.58%, suggesting a small amount of insider investors. The largest shareholder is Vanguard Group Inc, whose 12% stake in the company is worth $4,782,668,269.