Now trading at a price of $38.32, Comcast has moved -1.2% so far today.
Over the last year, Comcast logged a -4.6% change, with its stock price reaching a high of $47.46 and a low of $36.43. Over the same period, the stock underperformed the S&P 500 index by -27.3%. AThe company's 50-day average price was $39.42. Comcast Corporation operates as a media and technology company worldwide. Based in Philadelphia, PA, the Large-Cap Telecommunications company has 186,000 full time employees. Comcast has offered a 3.0% dividend yield over the last 12 months.
Growing Revenues but Not Enough Current Assets to Cover Current Liabilities:
| 2018 | 2019 | 2020 | 2021 | 2022 | 2023 | |
|---|---|---|---|---|---|---|
| Revenue (M) | $94,507 | $108,942 | $103,564 | $116,385 | $121,427 | $121,572 |
| Operating Margins | 20% | 19% | 17% | 18% | 12% | 19% |
| Net Margins | 12% | 12% | 10% | 12% | 4% | 13% |
| Net Income (M) | $11,731 | $13,057 | $10,534 | $14,159 | $5,370 | $15,388 |
| Net Interest Expense (M) | $3,542 | $4,567 | $4,588 | $4,281 | $3,896 | $4,087 |
| Depreciation & Amort. (M) | $8,281 | $8,663 | $8,320 | $8,628 | $8,724 | $8,854 |
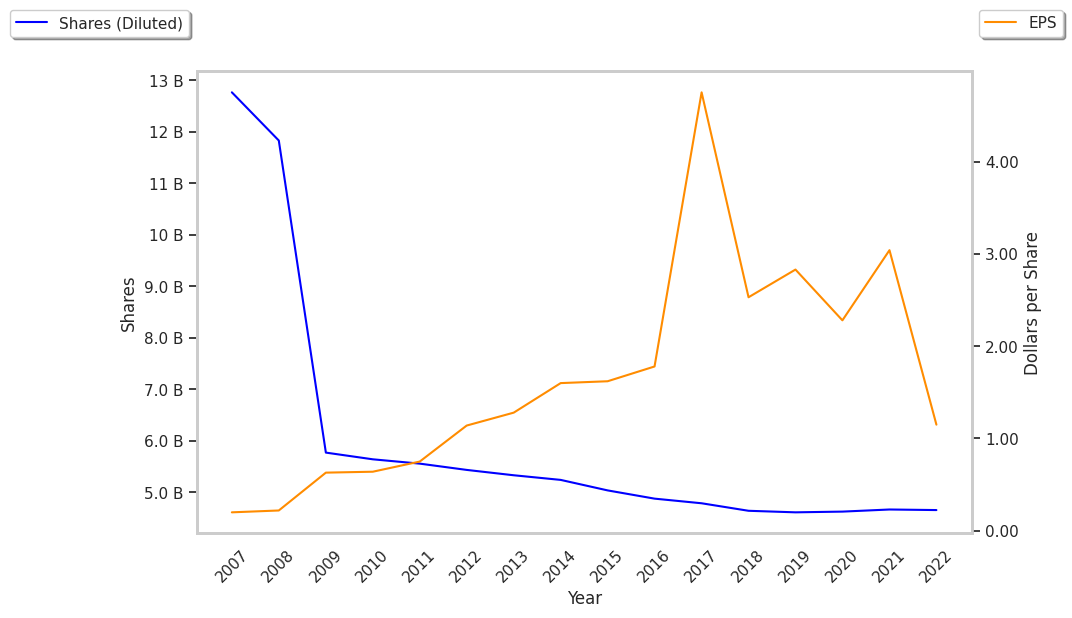
| Diluted Shares (M) | 4,640 | 4,610 | 4,624 | 4,654 | 4,430 | 4,148 |
| Earnings Per Share | $2.53 | $2.83 | $2.28 | $3.04 | $1.21 | $3.71 |
| EPS Growth | n/a | 11.86% | -19.43% | 33.33% | -60.2% | 206.61% |
| Avg. Price | $31.83 | $38.38 | $39.87 | $51.89 | $43.51 | $38.32 |
| Free Cash Flow (M) | $14,523 | $15,744 | $15,558 | $19,972 | $15,787 | $16,259 |
| CAPEX (M) | $9,774 | $9,953 | $9,179 | $9,174 | $10,626 | $12,242 |
| EV / EBITDA | 5267895.95 | 5854138.96 | 10.64 | 10.91 | 12.42 | 7.85 |
| Total Debt (M) | $111,743 | $102,217 | $103,760 | $94,850 | $94,811 | $97,090 |
| Net Debt / EBITDA | 3.95 | 3.25 | 3.56 | 2.93 | 3.96 | 2.83 |
| Current Ratio | 0.79 | 0.84 | 0.93 | 0.85 | 0.78 | 0.6 |
Comcast has growing revenues and increasing reinvestment in the business, positive EPS growth, and generally positive cash flows. However, the firm has not enough current assets to cover current liabilities because its current ratio is 0.6. Finally, we note that Comcast has decent operating margins with a stable trend and significant leverage levels.
Comcast Is Fairly Priced at Current Levels:
Comcast has a trailing twelve month P/E ratio of 10.5, compared to an average of 22.69 for the Telecommunications sector. Based on its EPS guidance of $4.51, the company has a forward P/E ratio of 8.7. The 8.6% compound average growth rate of Comcast's historical and projected earnings per share yields a PEG ratio of 1.21. This implies that the shares are fairly valued. Additionally, the market is possibly undervaluing Comcast in terms of its equity because its P/B ratio is 1.83 whereas the sector average is 1.97. The company's shares are currently trading -6.1% above their Graham number.
Comcast Has an Analyst Consensus of Some Upside Potential:
The 26 analysts following Comcast have set target prices ranging from $40.0 to $57.0 per share, for an average of $47.71 with a buy rating. The company is trading -19.7% away from its average target price, indicating that there is an analyst consensus of some upside potential.
Comcast has a very low short interest because 1.4% of the company's shares are sold short. Institutions own 88.6% of the company's shares, and the insider ownership rate stands at 0.69%, suggesting a small amount of insider investors. The largest shareholder is Vanguard Group Inc, whose 10% stake in the company is worth $14,362,792,774.