Williams logged a 0.4% change during today's morning session, and is now trading at a price of $58.15 per share.
Williams returned gains of 33.8% last year, with its stock price reaching a high of $63.45 and a low of $42.79. Over the same period, the stock outperformed the S&P 500 index by 15.2%. More recently, the company's 50-day average price was $59.43. The Williams Companies, Inc., together with its subsidiaries, operates as an energy infrastructure company primarily in the United States. Based in Tulsa, OK, the Large-Cap Utilities company has 5,829 full time employees. Williams has offered a 3.4% dividend yield over the last 12 months.
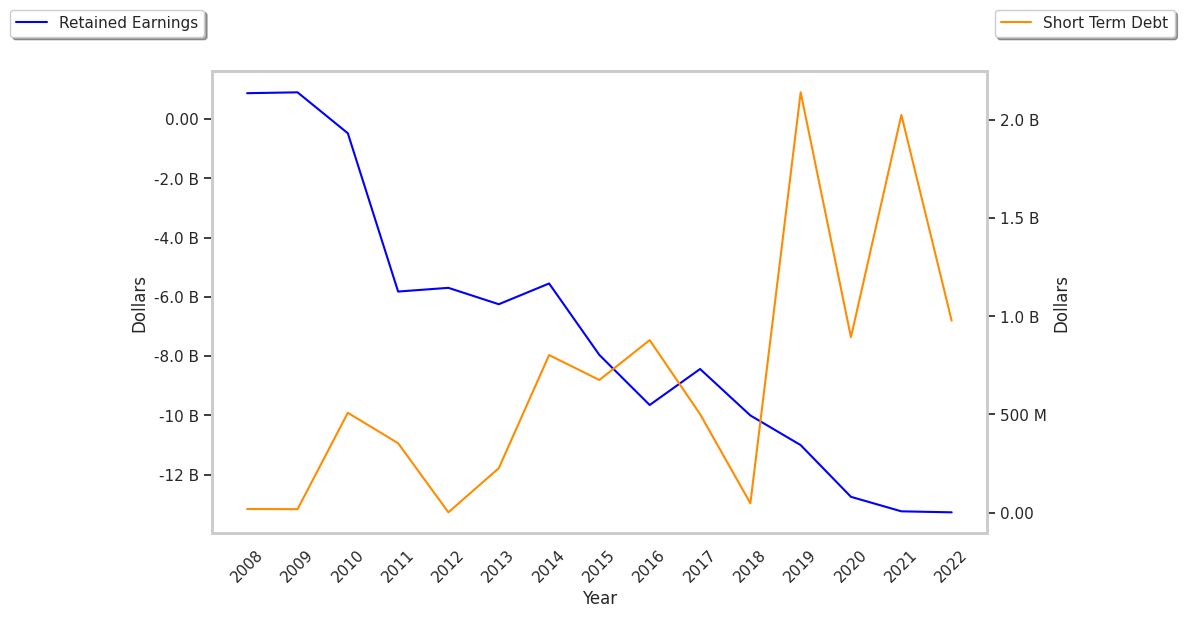
Exceptional Profitability Overshadowed by Excessive Leverage:
| 2019 | 2020 | 2021 | 2022 | 2023 | 2024 | |
|---|---|---|---|---|---|---|
| Revenue (M) | $8,201 | $7,719 | $10,627 | $10,965 | $10,907 | $10,503 |
| Operating Margins | 23% | 28% | 25% | 28% | 40% | 32% |
| Net Margins | 10% | 3% | 14% | 19% | 28% | 21% |
| Net Income (M) | $850 | $211 | $1,517 | $2,049 | $3,179 | $2,225 |
| Net Interest Expense (M) | $1,186 | $1,172 | $1,179 | $1,147 | $1,236 | $108 |
| Depreciation & Amort. (M) | $1,714 | $1,721 | $1,842 | $2,009 | $2,071 | $1,800 |
| Diluted Shares (M) | 1,214 | 1,215 | 1,218 | 1,223 | 1,223 | 1,223 |
| Earnings Per Share | $0.7 | $0.17 | $1.24 | $1.67 | $2.6 | $1.82 |
| EPS Growth | n/a | -75.71% | 629.41% | 34.68% | 55.69% | -30.0% |
| Avg. Price | $19.6 | $16.26 | $22.57 | $30.27 | $34.83 | $57.89 |
| P/E Ratio | 28.0 | 95.65 | 18.06 | 18.02 | 13.34 | 31.81 |
| Free Cash Flow (M) | $1,584 | $2,257 | $2,706 | $2,636 | $3,422 | $2,401 |
| CAPEX (M) | $2,109 | $1,239 | $1,239 | $2,253 | $2,516 | $2,573 |
| EV / EBITDA | 11.99 | 10.46 | 10.59 | 11.65 | 9.99 | 18.51 |
| Total Debt (M) | $20,148 | $21,451 | $21,650 | $21,927 | $23,376 | $24,736 |
| Net Debt / EBITDA | 5.46 | 5.43 | 4.46 | 4.33 | 3.34 | 4.8 |
| Current Ratio | 0.4 | 0.62 | 0.91 | 0.78 | 0.77 | 0.5 |
Williams has growing revenues and increasing reinvestment in the business and strong operating margins with a stable trend. Additionally, the company's financial statements display a strong EPS growth trend and generally positive cash flows. However, the firm suffers from not enough current assets to cover current liabilities because its current ratio is 0.5 and a highly leveraged balance sheet.
The Market May Be Overvaluing Williams's Earnings and Assets:
Williams has a trailing twelve month P/E ratio of 30.0, compared to an average of 21.16 for the Utilities sector. Based on its EPS guidance of $2.09, the company has a forward P/E ratio of 28.4. Williams's PEG ratio is 2.4 on the basis of the 12.5% weighted average of the company and the broader market's EPS compound average growth rates. This suggests that the company's shares are overvalued. Furthermore, Williams is likely overvalued compared to the book value of its equity, since its P/B ratio of 5.72 is higher than the sector average of 2.36. The company's shares are currently trading 184.9% below their Graham number. Overall, Williams's lofty valuation in terms of earnings and assets is to some extent attenuated by its strong cash flow trend and reasonable levels of debt.
Williams Has an Analyst Consensus of Some Upside Potential:
The 19 analysts following Williams have set target prices ranging from $43.0 to $74.0 per share, for an average of $63.46 with a buy rating. The company is trading -8.4% away from its average target price, indicating that there is an analyst consensus of some upside potential.
Williams has a very low short interest because 1.4% of the company's shares are sold short. Institutions own 89.0% of the company's shares, and the insider ownership rate stands at 0.46%, suggesting a small amount of insider investors. The largest shareholder is Vanguard Group Inc, whose 11% stake in the company is worth $7,627,139,349.