Zillow logged a -4.1% change during today's afternoon session, and is now trading at a price of $81.12 per share.
Zillow returned gains of 63.0% last year, with its stock price reaching a high of $89.39 and a low of $49.63. Over the same period, the stock outperformed the S&P 500 index by 44.4%. More recently, the company's 50-day average price was $74.22. Zillow Group, Inc. operates real estate brands in mobile applications and Websites in the United States. Based in Seattle, WA, the Large-Cap Consumer Discretionary company has 6,944 full time employees. Zillow has not offered a dividend during the last year.
Wider Gross Margins Than the Industry Average of 45.36%:
| 2019 | 2020 | 2021 | 2022 | 2023 | 2024 | |
|---|---|---|---|---|---|---|
| Revenue (M) | $2,743 | $1,624 | $2,132 | $1,958 | $1,945 | $2,236 |
| Gross Margins | 44% | 84% | 85% | 81% | 78% | 76% |
| Net Margins | -11% | -10% | -25% | -5% | -8% | -5% |
| Net Income (M) | -$305 | -$162 | -$528 | -$101 | -$158 | -$112 |
| Net Interest Expense (M) | $102 | $138 | $128 | $35 | $36 | $36 |
| Depreciation & Amort. (M) | $87 | $111 | $130 | $157 | $187 | $240 |
| Diluted Shares (M) | 206 | 231 | 262 | 242 | 234 | 234 |
| Earnings Per Share | -$1.48 | -$0.7 | -$2.02 | -$0.42 | -$0.68 | -$0.48 |
| EPS Growth | n/a | 52.7% | -188.57% | 79.21% | -61.9% | 29.41% |
| Avg. Price | $38.17 | $71.42 | $110.33 | $46.5 | $57.86 | $80.89 |
| P/E Ratio | -25.79 | -99.19 | -52.29 | -110.71 | -85.09 | -168.52 |
| Free Cash Flow (M) | -$679 | $338 | -$3,251 | $4,389 | $219 | $285 |
| CAPEX (M) | $67 | $85 | $74 | $115 | $135 | $143 |
| EV / EBITDA | -51.32 | 72.08 | 79.09 | 186.38 | -167.07 | 430.82 |
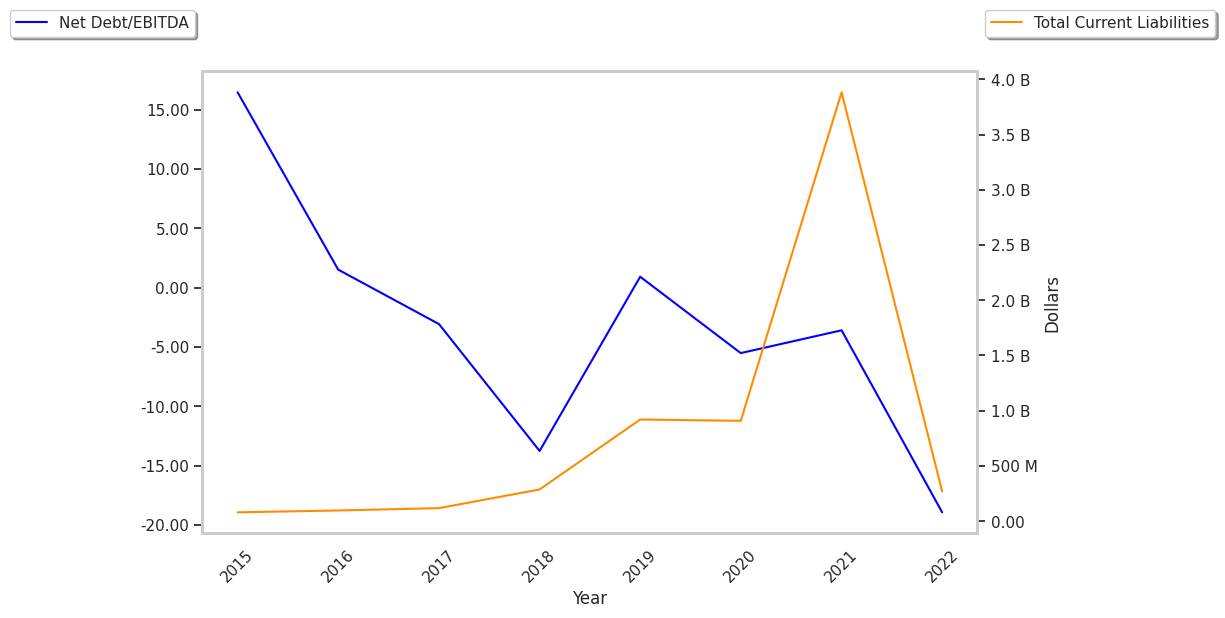
| Total Debt (M) | $1,543 | $2,614 | $4,946 | $1,738 | $1,800 | $722 |
| Net Debt / EBITDA | -2.51 | 4.14 | 7.13 | 4.25 | -3.71 | -8.37 |
| Current Ratio | 3.81 | 5.46 | 1.98 | 13.34 | 3.24 | 2.81 |
Zillow benefits from generally positive cash flows, an excellent current ratio of 2.81, and wider gross margins than its peer group. The company's financial statements show a strong EPS growth trend and healthy leverage levels. Furthermore, Zillow has declining revenues and increasing reinvestment in the business.
Since its earnings per share are currently negative, Zillow does not have a meaningful trailing twelve month P/E ratio. The Consumer Discretionary sector has an average P/E ratio of 20.93. Furthermore, Zillow is likely overvalued compared to the book value of its equity, since its P/B ratio of 4.12 is higher than the sector average of 2.93. In conclusion, Zillow's impressive cash flow trend, decent P/B ratio, and reasonable use of leverage demonstrate that the company may still be fairly valued -- despite its elevated earnings multiple.
Zillow Has an Average Rating of Hold:
The 6 analysts following Zillow have set target prices ranging from $82.0 to $94.0 per share, for an average of $87.67 with a hold rating. The company is trading -7.5% away from its average target price, indicating that there is an analyst consensus of some upside potential.
The largest shareholder is Caledonia (Private) Investments Pty Ltd, whose 17% stake in the company is worth $2,517,484,573.