Today we're going to take a closer look at Large-Cap Finance company Arch Capital, whose shares are currently trading at $91.8. We've been asking ourselves whether the company is under or over valued at today's prices... let's perform a brief value analysis to find out!
Arch Capital Is Fairly Priced at Current Levels:
Arch Capital Group Ltd., together with its subsidiaries, provides insurance, reinsurance, and mortgage insurance products in the United States, Canada, Bermuda, the United Kingdom, Europe, and Australia. The company belongs to the Finance sector, which has an average price to earnings (P/E) ratio of 15.92 and an average price to book (P/B) ratio of 1.78. In contrast, Arch Capital has a trailing 12 month P/E ratio of 9.5 and a P/B ratio of 1.55.
Arch Capital has moved -18.1% over the last year compared to 15.6% for the S&P 500 -- a difference of -33.7%. Arch Capital has a 52 week high of $116.47 and a 52 week low of $82.49.
The Company May Be Profitable, but Its Balance Sheet Is Highly Leveraged:
| 2019 | 2020 | 2021 | 2022 | 2023 | 2024 | |
|---|---|---|---|---|---|---|
| Revenue (M) | $6,926 | $8,509 | $9,248 | $9,613 | $13,634 | $17,440 |
| Interest Income (M) | $121 | $143 | $139 | $131 | $133 | $141 |
| Operating Margins | 27% | 19% | 26% | 16% | 26% | 27% |
| Net Margins | 24% | 17% | 23% | 15% | 33% | 25% |
| Net Income (M) | $1,636 | $1,406 | $2,157 | $1,476 | $4,443 | $4,312 |
| Depreciation & Amort. (M) | $82 | $69 | $82 | $106 | $95 | $235 |
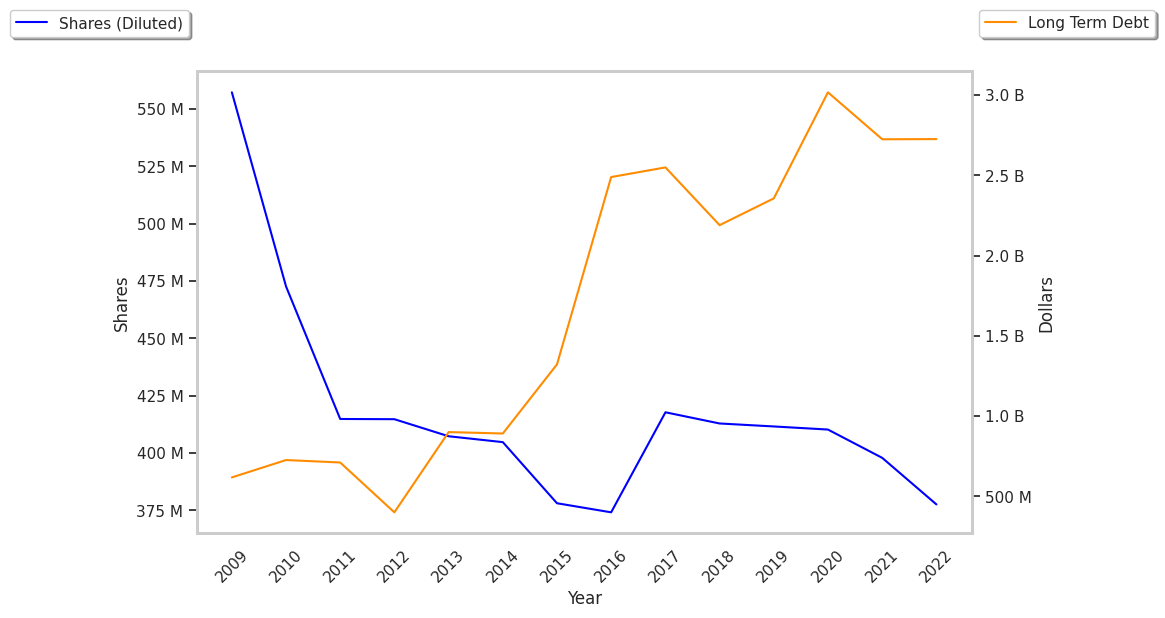
| Diluted Shares (M) | 412 | 410 | 400 | 378 | 379 | 382 |
| Earnings Per Share | $3.98 | $3.43 | $5.39 | $3.91 | $11.73 | $11.29 |
| EPS Growth | n/a | -13.82% | 57.14% | -27.46% | 200.0% | -3.75% |
| Avg. Price | $36.44 | $32.83 | $39.35 | $46.36 | $74.27 | $90.9 |
| P/E Ratio | 8.95 | 9.49 | 7.36 | 11.92 | 6.2 | 7.89 |
| Free Cash Flow (M) | $2,011 | $2,847 | $3,384 | $3,766 | $5,697 | $6,622 |
| CAPEX (M) | $38 | $40 | $41 | $50 | $52 | $51 |
| EV / EBITDA | 8.44 | 9.39 | 7.23 | 23.46 | 14.44 | 12.79 |
| Total Debt (M) | $2,356 | $3,017 | $2,724 | $22,408 | $26,279 | $29,763 |
| Net Debt / EBITDA | 0.84 | 1.28 | 0.76 | 12.92 | 6.92 | 5.86 |
Arch Capital has rapidly growing revenues and increasing reinvestment in the business and generally positive cash flows. Additionally, the company's financial statements display decent operating margins with a stable trend and a strong EPS growth trend. However, the firm has a highly leveraged balance sheet.