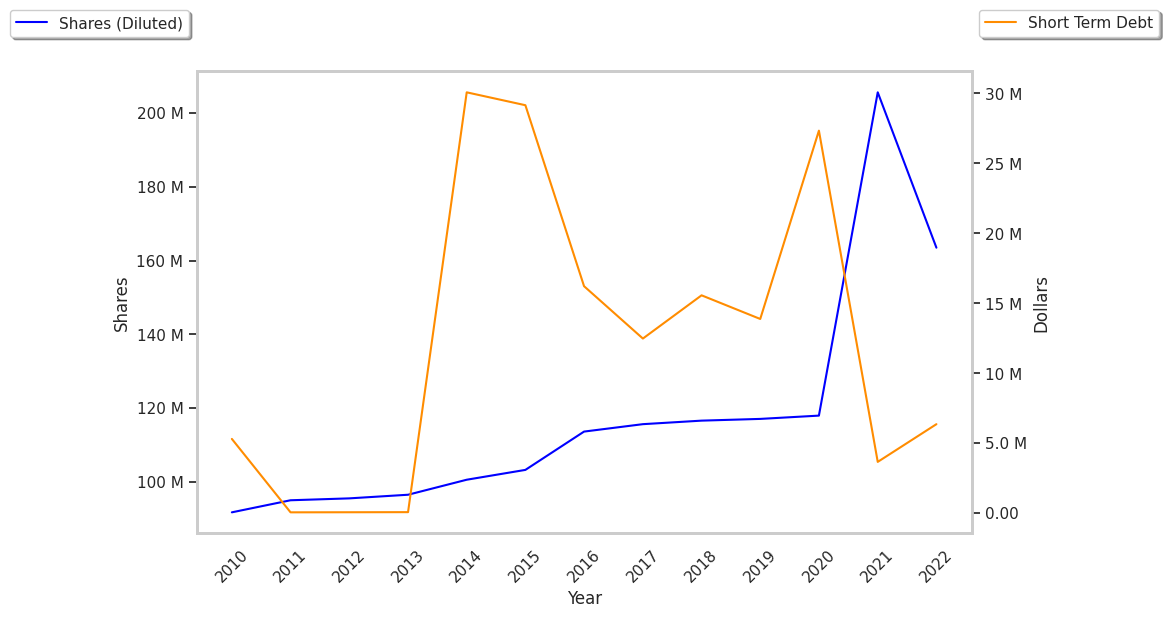
It's been a great afternoon session for Builders FirstSource investors, who saw their shares rise 4.1% to a price of $149.08 per share. At these higher prices, is the company still fairly valued? If you are thinking about investing, make sure to check the company's fundamentals before making a decision.
Earnings Expected to Improve but Its Shares Are Expensive:
Builders FirstSource, Inc., together with its subsidiaries, manufactures and supplies building materials, manufactured components, and construction services to professional homebuilders, sub-contractors, remodelers, and consumers in the United States. The company belongs to the Consumer Discretionary sector, which has an average price to earnings (P/E) ratio of 20.93 and an average price to book (P/B) ratio of 2.93. In contrast, Builders FirstSource has a trailing 12 month P/E ratio of 22.6 and a P/B ratio of 3.94.
Builders FirstSource has moved -15.0% over the last year compared to 20.2% for the S&P 500 — a difference of -35.2%. Builders FirstSource has a 52 week high of $203.14 and a 52 week low of $102.6.
Exceptional EPS Growth at the Expense of a Highly Leveraged Balance Sheet:
| 2019 | 2020 | 2021 | 2022 | 2023 | 2024 | |
|---|---|---|---|---|---|---|
| Revenue (M) | $7,280 | $8,559 | $19,894 | $22,726 | $17,097 | $16,400 |
| Gross Margins | 27% | 26% | 28% | 34% | 35% | 33% |
| Net Margins | 3% | 4% | 9% | 12% | 9% | 7% |
| Net Income (M) | $222 | $314 | $1,725 | $2,749 | $1,541 | $1,078 |
| Net Interest Expense (M) | -$110 | -$136 | -$136 | -$198 | -$192 | -$208 |
| Depreciation & Amort. (M) | $100 | $117 | $547 | $497 | $558 | $256 |
| Diluted Shares (M) | 117 | 118 | 203 | 163 | 129 | 119 |
| Earnings Per Share | $1.9 | $2.66 | $8.48 | $16.82 | $11.94 | $9.06 |
| EPS Growth | n/a | 40.0% | 218.8% | 98.35% | -29.01% | -24.12% |
| Avg. Price | $17.72 | $25.86 | $51.51 | $66.66 | $166.94 | $149.11 |
| P/E Ratio | 9.23 | 9.61 | 6.02 | 3.93 | 13.84 | 16.33 |
| Free Cash Flow (M) | $391 | $148 | $1,516 | $3,259 | $1,831 | $1,492 |
| CAPEX (M) | $113 | $112 | $228 | $340 | $476 | $381 |
| EV / EBITDA | 9.31 | 8.74 | 5.62 | 4.14 | 10.72 | 13.73 |
| Total Debt (M) | $2,555 | $3,194 | $5,904 | $5,956 | $6,355 | $7,401 |
| Net Debt / EBITDA | 5.16 | 4.19 | 2.0 | 1.38 | 2.3 | 3.91 |
| Current Ratio | 1.59 | 2.07 | 1.86 | 1.9 | 1.77 | 1.77 |
Builders FirstSource has rapidly growing revenues and increasing reinvestment in the business and exceptional EPS growth. Additionally, the company's financial statements display generally positive cash flows and a decent current ratio of 1.77. However, the firm has a highly leveraged balance sheet. Finally, we note that Builders FirstSource has similar gross margins to its peers.


