Today we're going to take a closer look at Large-Cap Consumer Staples company Monster Beverage, whose shares are currently trading at $64.42. We've been asking ourselves whether the company is under or over valued at today's prices... let's perform a brief value analysis to find out!
The Market May Be Overvaluing Monster Beverage's Earnings and Assets:
Monster Beverage Corporation, through its subsidiaries, engages in development, marketing, sale, and distribution of energy drink beverages and concentrates in the United States and internationally. The company belongs to the Consumer Staples sector, which has an average price to earnings (P/E) ratio of 25.91 and an average price to book (P/B) ratio of 3.03. In contrast, Monster Beverage has a trailing 12 month P/E ratio of 40.0 and a P/B ratio of 8.75.
Monster Beverage has moved 26.3% over the last year compared to 16.3% for the S&P 500 -- a difference of 10.0%. Monster Beverage has a 52 week high of $67.13 and a 52 week low of $45.7.
Increasing Revenues but Narrowing Margins:
| 2019 | 2020 | 2021 | 2022 | 2023 | 2024 | |
|---|---|---|---|---|---|---|
| Revenue (M) | $4,201 | $4,599 | $5,541 | $6,311 | $7,140 | $7,493 |
| Gross Margins | 60% | 59% | 56% | 50% | 53% | 54% |
| Net Margins | 26% | 31% | 25% | 19% | 23% | 20% |
| Net Income (M) | $1,108 | $1,410 | $1,377 | $1,192 | $1,631 | $1,509 |
| Net Interest Expense (M) | $13 | -$7 | $4 | -$13 | $115 | $25 |
| Depreciation & Amort. (M) | $61 | $57 | $50 | $61 | $69 | $80 |
| Diluted Shares (M) | 1,093 | 1,070 | 1,071 | 1,066 | 1,058 | 1,013 |
| Earnings Per Share | $1.01 | $1.32 | $1.29 | $1.12 | $1.54 | $1.49 |
| EPS Growth | n/a | 30.69% | -2.27% | -13.18% | 37.5% | -3.25% |
| Avg. Price | $29.59 | $36.63 | $45.87 | $42.93 | $57.61 | $64.64 |
| P/E Ratio | 29.01 | 27.96 | 35.28 | 37.99 | 36.93 | 44.58 |
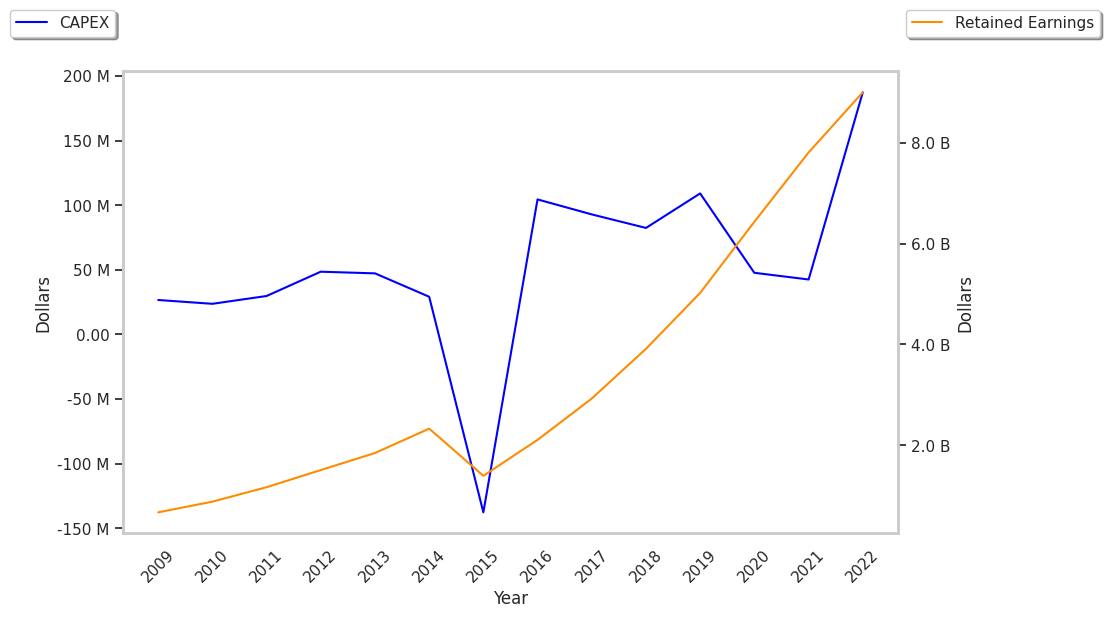
| Free Cash Flow (M) | $1,012 | $1,315 | $1,112 | $699 | $1,496 | $1,664 |
| CAPEX (M) | $102 | $49 | $44 | $189 | $221 | $264 |
| Current Ratio | 3.5 | 4.19 | 4.85 | 4.76 | 4.81 | 3.32 |
Monster Beverage has rapidly growing revenues and increasing reinvestment in the business and generally positive cash flows. Additionally, the company's financial statements display an excellent current ratio of 3.32 and positive EPS growth.