We've been asking ourselves recently if the market has placed a fair valuation on Dell Technologies. Let's dive into some of the fundamental values of this Large-Cap Technology company to determine if there might be an opportunity here for value-minded investors.
Dell Technologies Is Overpriced:
Dell Technologies Inc. designs, develops, manufactures, markets, sells, and supports various comprehensive and integrated solutions, products, and services in the Americas, Europe, the Middle East, Asia, and internationally. The company belongs to the Technology sector, which has an average price to earnings (P/E) ratio of 30.44. In contrast, Dell Technologies has a trailing 12 month P/E ratio of 22.8 based on its earnings per share of $6.85.
Dell Technologies has moved 22.1% over the last year compared to 15.8% for the S&P 500 -- a difference of 6.3%. Dell Technologies has a 52 week high of $166.1 and a 52 week low of $66.25.
EPS Trend Sustained Primarily by Reducing the Number of Shares Outstanding:
| 2019 | 2020 | 2021 | 2022 | 2023 | 2024 | |
|---|---|---|---|---|---|---|
| Revenue (M) | $84,815 | $86,670 | $101,197 | $102,301 | $88,425 | $95,567 |
| Gross Margins | 24% | 23% | 22% | 22% | 24% | 22% |
| Net Margins | 5% | 4% | 5% | 2% | 4% | 5% |
| Net Income (M) | $4,616 | $3,250 | $5,563 | $2,442 | $3,388 | $4,592 |
| Net Interest Expense (M) | -$2,417 | -$1,339 | $1,264 | -$2,546 | -$1,324 | $1,304 |
| Depreciation & Amort. (M) | $6,143 | $5,390 | $4,551 | $3,156 | $3,303 | $2,100 |
| Diluted Shares (M) | 771 | 788 | 743 | 740 | 717 | 702 |
| Earnings Per Share | $5.99 | $4.12 | $7.49 | $3.3 | $4.73 | $6.54 |
| EPS Growth | n/a | -31.22% | 81.8% | -55.94% | 43.33% | 38.27% |
| Avg. Price | $26.42 | $26.84 | $47.32 | $49.29 | $76.5 | $155.95 |
| P/E Ratio | 4.23 | 6.3 | 6.46 | 14.76 | 16.11 | 23.7 |
| Free Cash Flow (M) | $6,715 | $9,325 | $7,511 | $562 | $5,920 | $1,869 |
| CAPEX (M) | $2,576 | $2,082 | $2,796 | $3,003 | $2,756 | $2,652 |
| EV / EBITDA | 7.6 | 6.87 | 7.08 | 6.82 | 9.18 | 16.16 |
| Total Debt (M) | $56,397 | $64,259 | $34,096 | $33,115 | $30,634 | $33,626 |
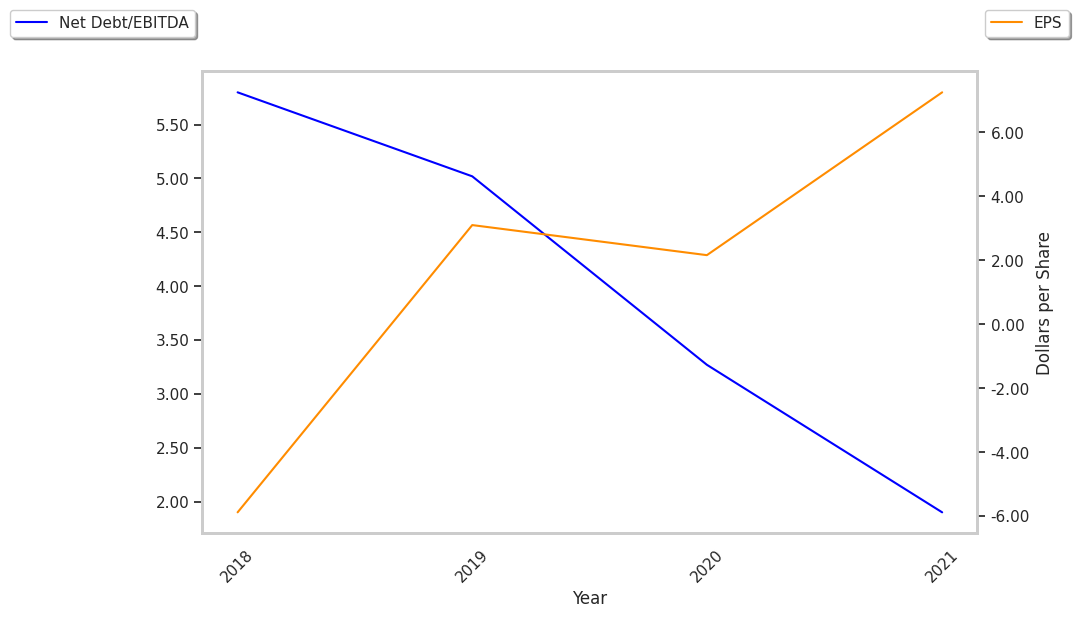
| Net Debt / EBITDA | 5.3 | 4.61 | 3.17 | 2.78 | 2.92 | 3.11 |
| Current Ratio | 0.77 | 0.82 | 0.75 | 0.76 | 0.77 | 0.85 |
Dell Technologies's financial statements include several red flags such as slimmer gross margins than its peers, EPS growth achieved by reducing the number of outstanding shares, and positive cash flows. Additionally, the firm has not enough current assets to cover current liabilities because its current ratio is 0.85. Dell Technologies has slight revenue growth and a flat capital expenditure trend and significant leverage levels.