Industrial Metals & Mining company Freeport-McMoRan is taking Wall Street by surprise today, falling to $40.9 and marking a -5.6% change compared to the S&P 500, which moved -2.0%. FCX is -11.85% below its average analyst target price of $46.39, which implies there is more upside for the stock.
As such, the average analyst rates it at buy. Over the last year, Freeport-McMoRan has underperfomed the S&P 500 by -29.3%, moving -13.4%.
Freeport-McMoRan Inc. engages in the mining of mineral properties in North America, South America, and Indonesia. The company belongs to the basic materials sector, which includes the chemical, coal, mining, aluminum, and steel industries. The demand for these materials is dependent on economic cycles: when the economy is growing, companies across all sectors ramp up production, which increases demand from basic materials companies.
Conversely, when the economy slows down, demand for these materials decreases. The stock prices of this sector tend to follow the ebbs and flows of these demand cycles — but accurately predicting where we are presently in the economic cycle is a matter of intense debate.
Freeport-McMoRan's trailing 12 month P/E ratio is 31.0, based on its trailing EPS of $1.32. The company has a forward P/E ratio of 20.0 according to its forward EPS of $2.16 -- which is an estimate of what its earnings will look like in the next quarter. The P/E ratio is the company's share price divided by its earnings per share. In other words, it represents how much investors are willing to spend for each dollar of the company's earnings (revenues minus the cost of goods sold, taxes, and overhead). As of the third quarter of 2024, the basic materials sector has an average P/E ratio of 20.25, and the average for the S&P 500 is 29.3.
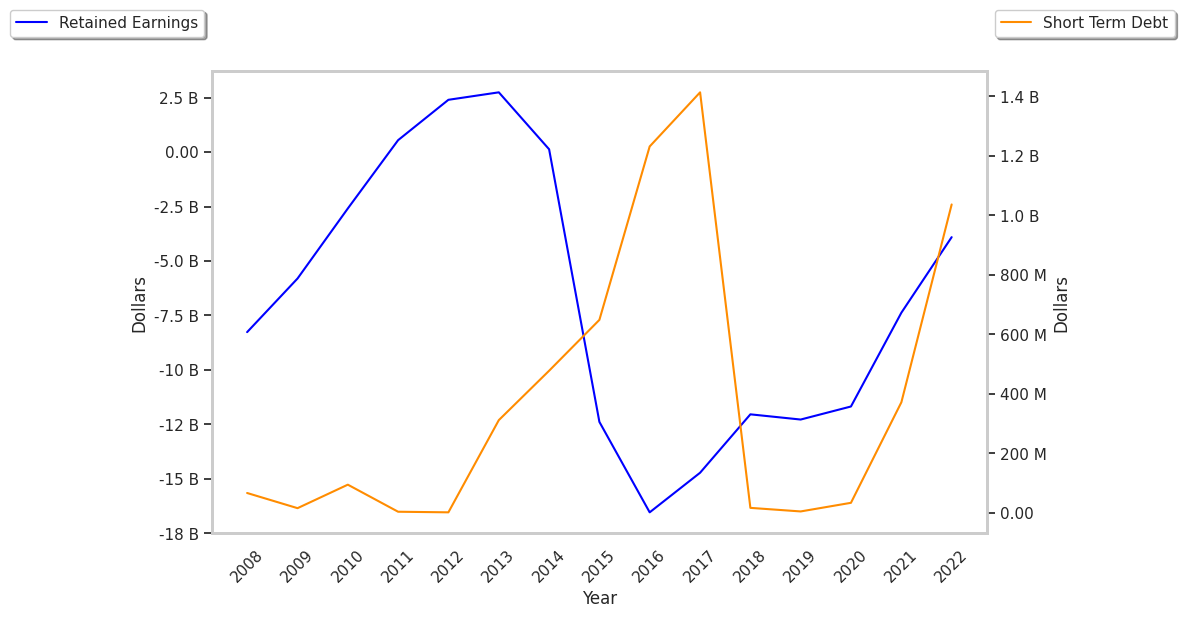
When we subtract capital expenditures from operating cash flows, we are left with the company's free cash flow, which for Freeport-McMoRan was $2.35 Billion as of its last annual report. Over the last 4 years, the company's average free cash flow has been $1.66 Billion and they've been growing at an average rate of 111.4%. With such strong cash flows, the company can not only re-invest in its business, it can afford to offer regular returns to its equity investors in the form of dividends. Over the last 12 months, investors in FCX have received an annualized dividend yield of 1.4% on their capital.
Value investors often analyze stocks through the lens of its Price to Book (P/B) Ratio (its share price divided by its book value). The book value refers to the present value of the company if the company were to sell off all of its assets and pay all of its debts today - a number whose value may differ significantly depending on the accounting method. Freeport-mcmoran's P/B ratio is 3.22 -- in other words, the market value of the company exceeds its book value by a factor of more than 3, so the company's assets may be overvalued compared to the average P/B ratio of the Basic Materials sector, which stands at 2.31 as of the third quarter of 2024.
Freeport-McMoRan is likely undervalued at today's prices because it has a higher P/E ratio than its sector average, an average P/B ratio, and generally positive cash flows with an upwards trend. The stock has strong growth indicators because of its strong operating margins with a positive growth rate, and an above average PEG ratio. We hope this preliminary analysis will encourage you to do your own research into FCX's fundamental values -- especially their trends over the last few years, which provide the clearest picture of the company's valuation.