Bristol-Myers Squibb may be undervalued with poor growth indicators, but the 21 analysts following the company give it an rating of hold. Their target prices range from $34.0 to $68.0 per share, for an average of $53.05. At today's price of $44.71, Bristol-Myers Squibb is trading -15.72% away from its average target price, suggesting there is an analyst consensus of some upside potential for the stock.
Bristol-Myers Squibb Company discovers, develops, licenses, manufactures, markets, distributes, and sells biopharmaceutical products worldwide. Based in Princeton, NJ, the Large-Cap Health Care company has 34,100 full time employees. Bristol-Myers Squibb has provided a 5.5% dividend yield over the last 12 months.
Bristol-Myers Squibb has a trailing twelve month P/E ratio of 18.0, compared to an average of 22.94 for the Health Care sector. Considering its EPS guidance of $7.03, the company has a forward P/E ratio of 6.4.
Bristol-Myers Squibb is overpriced compared to its book value, since its P/B ratio of 5.22 is higher than the sector average of 3.19.
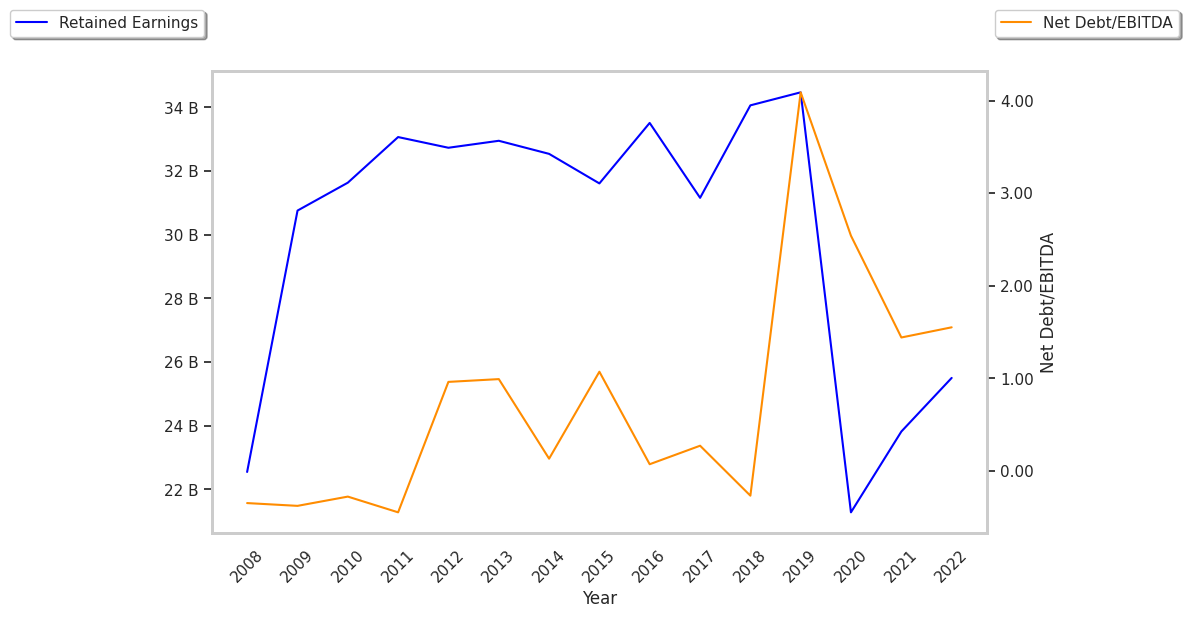
Why would analysts be giving such an undervalued stock a bad rating? It's possible that analysts are looking beyond common valuation metrics and taking into account the company's potentially irresponsible use of debt to operate its business. They might also believe Bristol-Myers Squibb's negative margin growth trend will continue.
| 2019 | 2020 | 2021 | 2022 | 2023 | 2024 | |
|---|---|---|---|---|---|---|
| Revenue (M) | $26,145 | $42,518 | $46,385 | $46,159 | $45,006 | $48,300 |
| Operating Margins | 19% | -16% | 17% | 17% | 19% | -17% |
| Net Margins | 13% | -21% | 15% | 14% | 18% | -19% |
| Net Income (M) | $3,439 | -$9,015 | $6,994 | $6,327 | $8,025 | -$8,948 |
| Net Interest Expense (M) | $656 | $1,420 | $1,334 | $1,232 | $1,166 | $1,800 |
| Depreciation & Amort. (M) | $1,746 | $10,380 | $10,686 | $10,276 | $9,760 | $651 |
| Diluted Shares (M) | 1,712 | 2,258 | 2,245 | 2,146 | 2,078 | 2,027 |
| Earnings Per Share | $2.01 | -$3.99 | $3.12 | $2.95 | $3.86 | -$4.41 |
| EPS Growth | n/a | -298.51% | 178.2% | -5.45% | 30.85% | -214.25% |
| Avg. Price | $44.09 | $54.98 | $58.88 | $68.82 | $51.31 | $44.54 |
| P/E Ratio | 21.83 | -13.78 | 18.69 | 23.17 | 13.22 | -10.1 |
| Free Cash Flow (M) | $7,374 | $13,299 | $15,234 | $11,948 | $12,651 | $13,942 |
| CAPEX (M) | $836 | $753 | $973 | $1,118 | $1,209 | $1,248 |
| EV / EBITDA | 16.24 | 46.24 | 8.9 | 10.23 | 7.63 | -16.98 |
| Total Debt (M) | $49,496 | $52,676 | $49,317 | $43,217 | $42,645 | $51,477 |
| Net Debt / EBITDA | 5.53 | 10.87 | 1.88 | 1.9 | 1.71 | -5.32 |
| Current Ratio | 1.6 | 1.58 | 1.52 | 1.25 | 1.43 | 1.25 |