Humana logged a 0.6% change during today's morning session, and is now trading at a price of $239.73 per share.
Humana returned losses of -14.9% last year, with its stock price reaching a high of $315.35 and a low of $206.87. Over the same period, the stock underperformed the S&P 500 index by -29.0%. AThe company's 50-day average price was $276.72. Humana Inc. provides medical and specialty insurance products in the United States. Based in Louisville, KY, the Large-Cap Health Care company has 65,680 full time employees. Humana has offered a 1.5% dividend yield over the last 12 months.
Increasing Revenues but Narrowing Margins:
| 2019 | 2020 | 2021 | 2022 | 2023 | 2024 | |
|---|---|---|---|---|---|---|
| Revenue (M) | $64,888 | $77,155 | $83,064 | $92,870 | $106,374 | $117,761 |
| Operating Margins | 5% | 6% | 4% | 4% | 4% | 2% |
| Net Margins | 4% | 4% | 4% | 3% | 2% | 1% |
| Net Income (M) | $2,707 | $3,367 | $2,933 | $2,806 | $2,489 | $1,207 |
| Net Interest Expense (M) | $242 | $283 | $326 | $401 | $493 | $584 |
| Depreciation & Amort. (M) | $505 | $528 | $640 | $749 | $850 | $908 |
| Diluted Shares (M) | 135 | 133 | 129 | 127 | 124 | 121 |
| Earnings Per Share | $20.1 | $25.31 | $22.67 | $22.08 | $20.0 | $9.98 |
| EPS Growth | n/a | 25.92% | -10.43% | -2.6% | -9.42% | -50.1% |
| Avg. Price | $277.02 | $374.9 | $419.98 | $429.4 | $457.81 | $238.42 |
| P/E Ratio | 13.71 | 14.72 | 18.43 | 19.34 | 22.79 | 23.82 |
| Free Cash Flow (M) | $4,548 | $4,675 | $920 | $3,450 | $2,977 | $2,391 |
| CAPEX (M) | $736 | $964 | $1,342 | $1,137 | $1,004 | $575 |
| EV / EBITDA | 10.59 | 9.34 | 16.69 | 13.29 | 13.2 | 11.03 |
| Total Debt (M) | $5,666 | $6,660 | $12,494 | $11,126 | $11,656 | $11,721 |
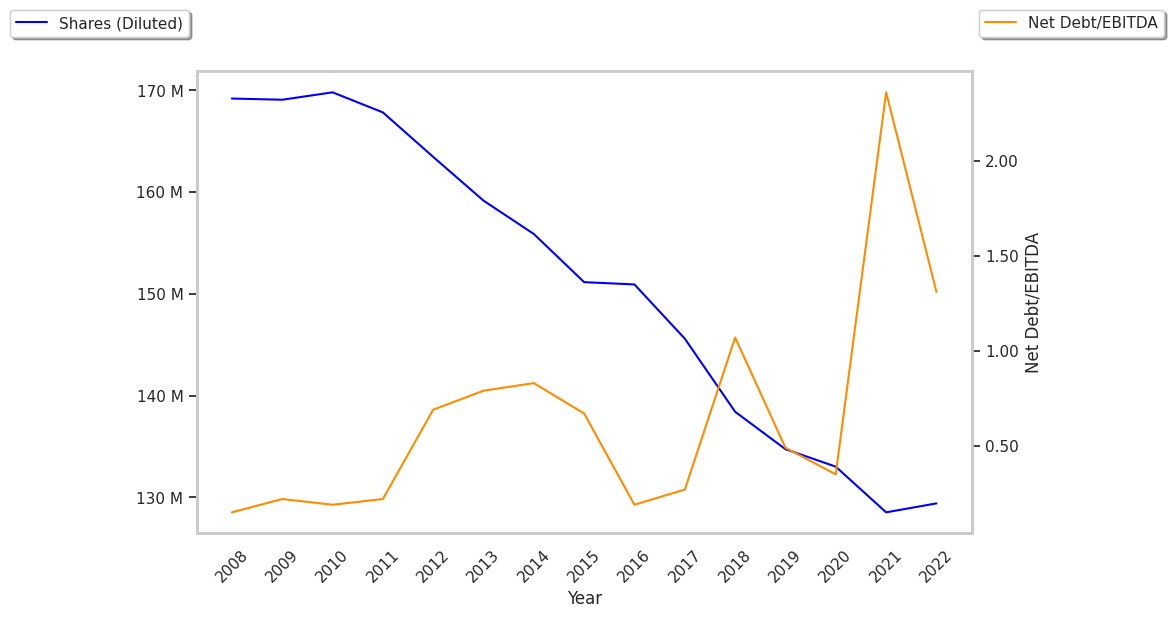
| Net Debt / EBITDA | 0.44 | 0.36 | 2.4 | 1.33 | 1.43 | 2.74 |
| Current Ratio | 1.82 | 1.77 | 1.62 | 1.52 | 1.59 | 1.76 |
Humana has weak operating margins with a negative growth trend, declining EPS growth, and positive cash flows. On the other hand, the company benefits from rapidly growing revenues and decreasing reinvestment in the business and a decent current ratio of 1.76. Furthermore, Humana has significant leverage levels.
a Lower P/B Ratio Than Its Sector Average but Priced Beyond Its Margin of Safety:
Humana has a trailing twelve month P/E ratio of 25.9, compared to an average of 22.94 for the Health Care sector. Based on its EPS guidance of $16.84, the company has a forward P/E ratio of 16.4. The -2.5% compound average growth rate of Humana's historical and projected earnings per share yields a PEG ratio of -10.38. This indicates that its shares are overvalued.In contrast, the market is likely undervaluing Humana in terms of its equity because its P/B ratio is 1.56 while the sector average is 3.19. The company's shares are currently trading 37.4% below their Graham number.
Humana Has an Average Rating of Hold:
The 24 analysts following Humana have set target prices ranging from $231.0 to $353.0 per share, for an average of $288.46 with a hold rating. The company is trading -16.9% away from its average target price, indicating that there is an analyst consensus of some upside potential.
Humana has an average amount of shares sold short because 3.7% of the company's shares are sold short. Institutions own 101.6% of the company's shares, and the insider ownership rate stands at 0.21%, suggesting a small amount of insider investors. The largest shareholder is Vanguard Group Inc, whose 12% stake in the company is worth $3,393,616,809.