NVIDIA shares fell by -2.9% during the day's morning session, and are now trading at a price of $193.31. Is it time to buy the dip? To better answer that question, it's essential to check if the market is valuing the company's shares fairly in terms of its earnings and equity levels.
NVIDIA Has Elevated P/B and P/E Ratios:
NVIDIA Corporation, a computing infrastructure company, provides graphics and compute and networking solutions in the United States, Singapore, Taiwan, China, Hong Kong, and internationally. The company belongs to the Technology sector, which has an average price to earnings (P/E) ratio of 30.44 and an average price to book (P/B) ratio of 4.19. In contrast, NVIDIA has a trailing 12 month P/E ratio of 55.2 and a P/B ratio of 47.0.
NVIDIA has moved 34.2% over the last year compared to 14.2% for the S&P 500 -- a difference of 20.1%. NVIDIA has a 52 week high of $212.19 and a 52 week low of $86.62.
Wider Gross Margins Than the Industry Average of 42.19%:
| 2019 | 2020 | 2021 | 2022 | 2023 | 2024 | |
|---|---|---|---|---|---|---|
| Revenue (M) | $10,918 | $16,675 | $26,914 | $26,974 | $60,922 | $130,497 |
| Gross Margins | 62% | 62% | 65% | 56% | 73% | 75% |
| Net Margins | 26% | 26% | 36% | 16% | 49% | 56% |
| Net Income (M) | $2,796 | $4,332 | $9,752 | $4,368 | $29,760 | $72,880 |
| Net Interest Expense (M) | $52 | $184 | $236 | $262 | $257 | $246 |
| Depreciation & Amort. (M) | $381 | $1,098 | $1,174 | $1,544 | $1,508 | $1,300 |
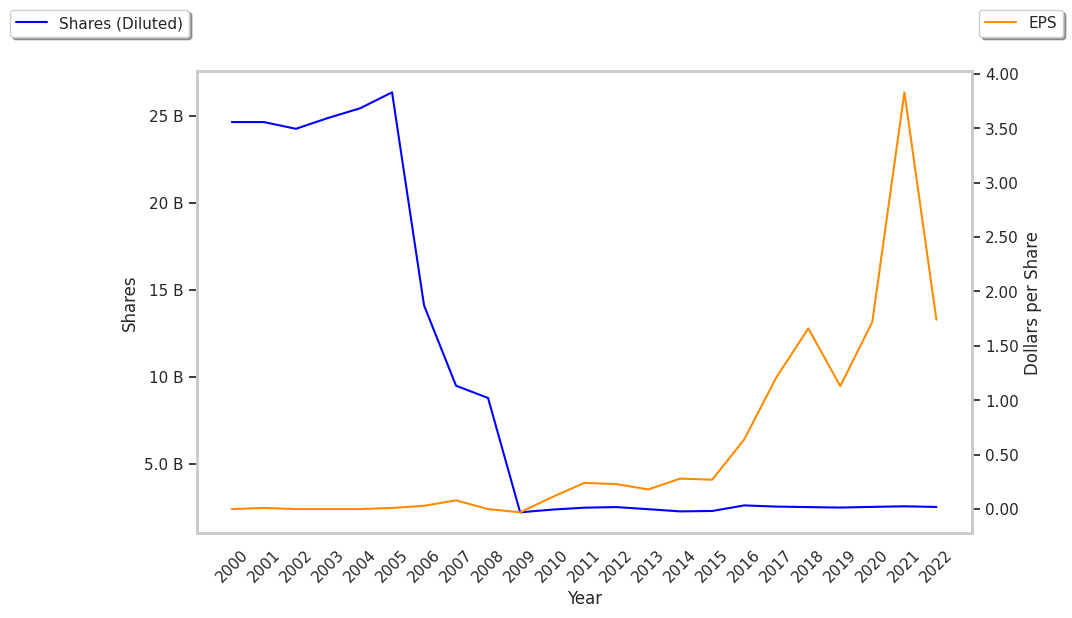
| Diluted Shares (M) | 25,200 | 25,380 | 24,990 | 24,940 | 24,774 | 24,611 |
| Earnings Per Share | $0.11 | $0.17 | $0.39 | $0.18 | $1.2 | $2.96 |
| EPS Growth | n/a | 54.55% | 129.41% | -53.85% | 566.67% | 146.67% |
| Avg. Price | $43.41 | $98.64 | $194.93 | $216.93 | $495.22 | $199.05 |
| P/E Ratio | 394.64 | 580.24 | 499.82 | 1205.17 | 416.15 | 66.57 |
| Free Cash Flow (M) | $4,549 | $5,665 | $8,132 | $5,132 | $27,021 | $60,853 |
| CAPEX (M) | $212 | $157 | $976 | $509 | $1,069 | $3,236 |
| EV / EBITDA | 331.08 | 436.22 | 437.11 | 929.89 | 359.04 | 58.61 |
| Total Debt (M) | $7,959 | $10,944 | $12,199 | $10,955 | $8,462 | $8,464 |
| Net Debt / EBITDA | 1.77 | 1.72 | 0.84 | 0.94 | -0.02 | -0.08 |
| Current Ratio | 3.92 | 7.14 | 3.39 | 3.59 | 4.1 | 3.39 |
NVIDIA has rapidly growing revenues and increasing reinvestment in the business, exceptional EPS growth, and generally positive cash flows. The company also benefits from an excellent current ratio of 3.39, wider gross margins than its peer group, and healthy leverage levels.