We've been asking ourselves recently if the market has placed a fair valuation on United Airlines. Let's dive into some of the fundamental values of this Large-Cap Consumer Discretionary company to determine if there might be an opportunity here for value-minded investors.
United Airlines Has Attractive Multiples and Trades Near Its Graham Number:
United Airlines Holdings, Inc., through its subsidiaries, provides air transportation services in the United States, Canada, Atlantic, the Pacific, and Latin America. The company belongs to the Consumer Discretionary sector, which has an average price to earnings (P/E) ratio of 20.93 and an average price to book (P/B) ratio of 2.93. In contrast, United Airlines has a trailing 12 month P/E ratio of 9.6 and a P/B ratio of 2.16.
United Airlines has moved 7.9% over the last year compared to 14.2% for the S&P 500 — a difference of -6.3%. United Airlines has a 52 week high of $116.0 and a 52 week low of $52.0.
The Firm Has a Declining EPS Growth Trend:
| 2019 | 2020 | 2021 | 2022 | 2023 | 2024 | |
|---|---|---|---|---|---|---|
| Revenue (M) | $43,259 | $15,355 | $24,634 | $44,955 | $53,717 | $57,063 |
| Operating Margins | 10% | -41% | -4% | 5% | 8% | 9% |
| Net Margins | 7% | -46% | -8% | 2% | 5% | 6% |
| Net Income (M) | $3,009 | -$7,069 | -$1,964 | $737 | $2,618 | $3,149 |
| Net Interest Expense (M) | $731 | $1,063 | $1,657 | $1,778 | $1,956 | $1,494 |
| Depreciation & Amort. (M) | $2,288 | $2,488 | $2,485 | $2,456 | $2,671 | $2,928 |
| Diluted Shares (M) | 260 | 279 | 322 | 330 | 332 | 333 |
| Earnings Per Share | $11.58 | -$25.3 | -$6.1 | $2.23 | $7.89 | $9.45 |
| EPS Growth | n/a | -318.48% | 75.89% | 136.56% | 253.81% | 19.77% |
| Avg. Price | $86.83 | $42.65 | $49.43 | $43.35 | $41.26 | $96.14 |
| P/E Ratio | 7.47 | -1.69 | -8.1 | 19.18 | 5.17 | 10.04 |
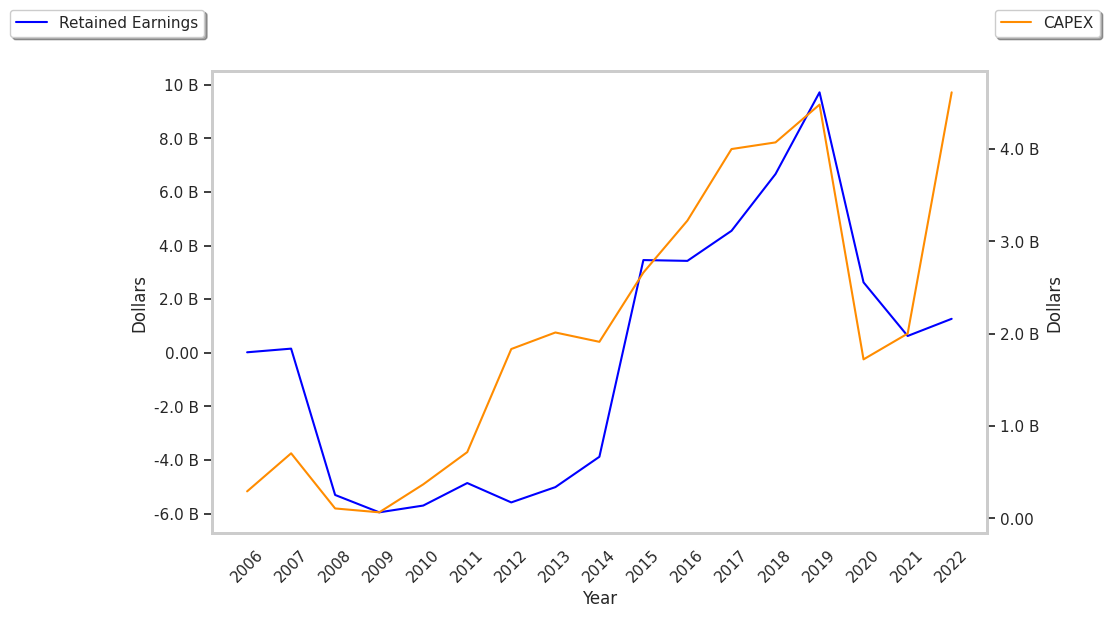
| Free Cash Flow (M) | $2,381 | -$5,860 | -$40 | $1,247 | -$260 | $3,830 |
| CAPEX (M) | $4,528 | $1,727 | $2,107 | $4,819 | $7,171 | $5,615 |
| EV / EBITDA | 5.3 | -6.73 | 21.07 | 7.95 | 5.65 | 6.41 |
| Total Debt (M) | $14,552 | $26,747 | $33,363 | $31,194 | $31,431 | $28,656 |
| Net Debt / EBITDA | 1.79 | -4.0 | 10.31 | 5.01 | 3.69 | 2.48 |
| Current Ratio | 0.55 | 1.16 | 1.19 | 1.0 | 0.83 | 0.81 |
United Airlines has growing revenues and increasing reinvestment in the business, generally positive cash flows, and healthy leverage levels. However, the firm suffers from declining EPS growth and not enough current assets to cover current liabilities because its current ratio is 0.81. Finally, we note that United Airlines has decent operating margins with a stable trend.