We've been asking ourselves recently if the market has placed a fair valuation on Willis Towers Watson Public. Let's dive into some of the fundamental values of this Large-Cap Finance company to determine if there might be an opportunity here for value-minded investors.
Willis Towers Watson Public Shares Are Expensive:
Willis Towers Watson Public Limited Company operates as an advisory, broking, and solutions company worldwide. The company belongs to the Finance sector, which has an average price to earnings (P/E) ratio of 15.92 and an average price to book (P/B) ratio of 1.78. In contrast, Willis Towers Watson Public has a trailing 12 month P/E ratio of 15.3 and a P/B ratio of 3.98.
Willis Towers Watson Public has moved 1.3% over the last year compared to 14.2% for the S&P 500 — a difference of -12.9%. Willis Towers Watson Public has a 52 week high of $352.79 and a 52 week low of $292.97.
The Business Is Unprofitable and Its Balance Sheet Is Highly Leveraged:
| 2019 | 2020 | 2021 | 2022 | 2023 | 2024 | |
|---|---|---|---|---|---|---|
| Revenue (M) | $8,370 | $8,615 | $8,998 | $8,866 | $9,483 | $9,930 |
| Interest Income (M) | $234 | $244 | $211 | $208 | $235 | $263 |
| Operating Margins | 13% | 10% | 24% | 13% | 14% | 6% |
| Net Margins | 12% | 12% | 47% | 11% | 11% | -1% |
| Net Income (M) | $1,044 | $996 | $4,222 | $1,009 | $1,055 | -$98 |
| Depreciation & Amort. (M) | $240 | $308 | $281 | $255 | $242 | $230 |
| Diluted Shares (M) | 130 | 130 | 129 | 112 | 106 | 102 |
| Earnings Per Share | $8.03 | $7.66 | $32.73 | $9.01 | $9.95 | -$0.96 |
| EPS Growth | n/a | -4.61% | 327.28% | -72.47% | 10.43% | -109.65% |
| Avg. Price | $173.55 | $191.16 | $224.76 | $216.46 | $241.2 | $321.61 |
| P/E Ratio | 21.45 | 24.7 | 6.86 | 25.26 | 24.36 | -335.01 |
| Free Cash Flow (M) | $745 | $1,505 | $1,867 | $614 | $1,094 | $1,269 |
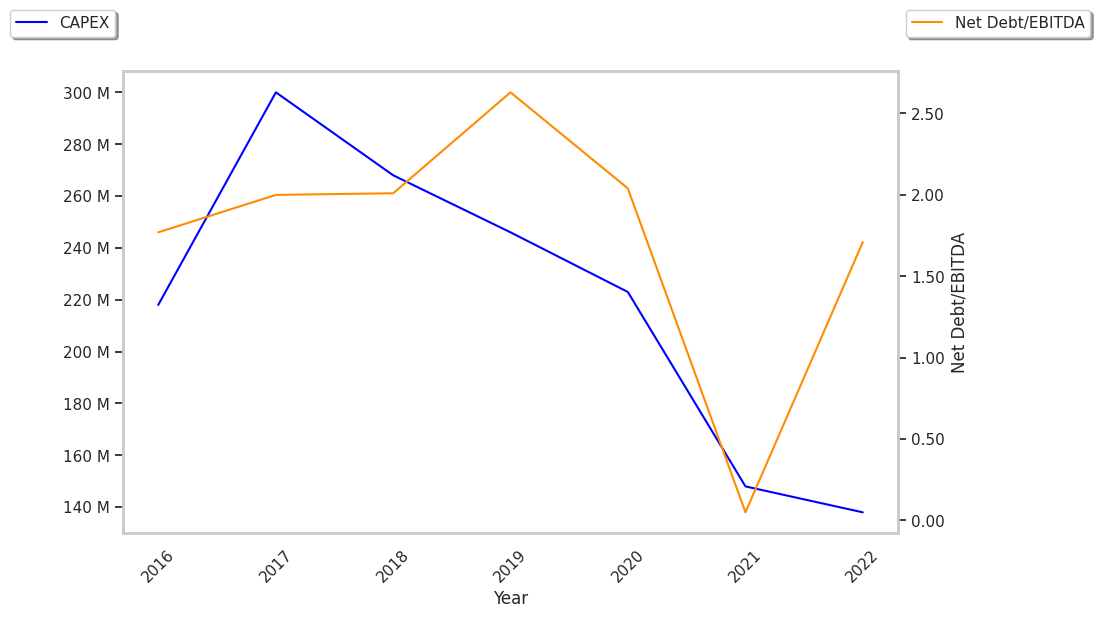
| CAPEX (M) | $336 | $269 | $194 | $198 | $251 | $243 |
| EV / EBITDA | 23.07 | 26.93 | 12.79 | 21.79 | 20.14 | 46.3 |
| Total Debt (M) | $8,333 | $8,855 | $7,249 | $7,006 | $8,085 | $8,611 |
| Net Debt / EBITDA | 5.75 | 5.84 | 1.11 | 4.01 | 4.14 | 7.84 |
| Current Ratio | 1.06 | 1.05 | 1.26 | 1.07 | 1.06 | 1.2 |
Willis Towers Watson Public has weak operating margins with a negative growth trend, declining EPS growth, and a highly leveraged balance sheet. On the other hand, the company has generally positive cash flows working in its favor. Furthermore, Willis Towers Watson Public has growing revenues and decreasing reinvestment in the business and just enough current assets to cover current liabilities, as shown by its current ratio of 1.2.