It's been a great evening session for Church & Dwight investors, who saw their shares rise 3.1% to a price of $93.51 per share. At these higher prices, is the company still fairly valued? If you are thinking about investing, make sure to check the company's fundamentals before making a decision.
Church & Dwight's Valuation Is in Line With Its Sector Averages:
Church & Dwight Co., Inc. develops, manufactures, and markets household, personal care, and specialty products. The company belongs to the Consumer Discretionary sector, which has an average price to earnings (P/E) ratio of 20.93 and an average price to book (P/B) ratio of 2.93. In contrast, Church & Dwight has a trailing 12 month P/E ratio of 30.8 and a P/B ratio of 5.29.
Church & Dwight's PEG ratio is 2.92, which shows that the stock is probably overvalued in terms of its estimated growth. For reference, a PEG ratio near or below 1 is a potential signal that a company is undervalued.
Growing Revenues but Slimmer Gross Margins than the Industry Average of 59.94%:
| 2020 | 2021 | 2022 | 2023 | 2024 | 2025 | |
|---|---|---|---|---|---|---|
| Revenue (M) | $4,896 | $5,190 | $5,376 | $5,868 | $6,107 | $6,203 |
| Gross Margins | 45% | 44% | 42% | 44% | 46% | 45% |
| Net Margins | 16% | 16% | 8% | 13% | 10% | 12% |
| Net Income (M) | $786 | $828 | $414 | $756 | $585 | $737 |
| Net Interest Expense (M) | $61 | $54 | $90 | $111 | $95 | $95 |
| Depreciation & Amort. (M) | $66 | $68 | $67 | $73 | $83 | $90 |
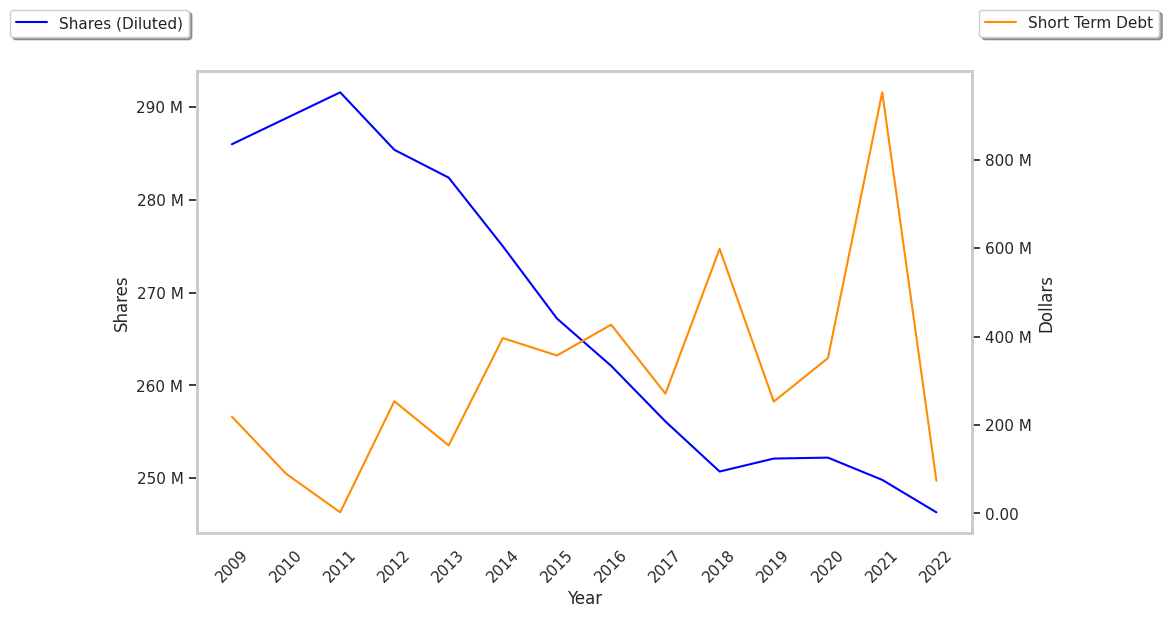
| Diluted Shares (M) | 252 | 250 | 246 | 248 | 247 | 244 |
| Earnings Per Share | $3.12 | $3.32 | $1.68 | $3.05 | $2.37 | $3.02 |
| EPS Growth | n/a | 6.41% | -49.4% | 81.55% | -22.3% | 27.43% |
| Avg. Price | $78.12 | $84.38 | $95.49 | $94.56 | $104.47 | $90.72 |
| P/E Ratio | 24.41 | 24.96 | 55.84 | 30.5 | 43.53 | 30.24 |
| Free Cash Flow (M) | $891 | $875 | $706 | $807 | $976 | $907 |
| CAPEX (M) | $99 | $119 | $179 | $224 | $180 | $122 |
| EV / EBITDA | 19.0 | 20.43 | 38.36 | 22.42 | 30.0 | 20.65 |
| Total Debt (M) | $1,812 | $3,010 | $2,600 | $2,602 | $2,205 | $2,205 |
| Net Debt / EBITDA | 1.49 | 2.41 | 3.5 | 2.0 | 1.39 | 1.54 |
| Current Ratio | 0.8 | 0.59 | 1.18 | 1.08 | 1.7 | 1.07 |
Church & Dwight has growing revenues and a flat capital expenditure trend, generally positive cash flows, and healthy leverage levels. However, the firm has slimmer gross margins than its peers. Finally, we note that Church & Dwight has flat EPS growth and just enough current assets to cover current liabilities, as shown by its current ratio of 1.07.