Lennar shares fell by -1.4% during the day's evening session, and are now trading at a price of $85.85. Is it time to buy the dip? To better answer that question, it's essential to check if the market is valuing the company's shares fairly in terms of its earnings and equity levels.
The Market May Be Undervaluing Lennar's Assets and Equity:
Lennar Corporation, together with its subsidiaries, operates as a homebuilder primarily under the Lennar brand in the United States. The company belongs to the Consumer Discretionary sector, which has an average price to earnings (P/E) ratio of 20.93 and an average price to book (P/B) ratio of 2.93. In contrast, Lennar has a trailing 12 month P/E ratio of 12.4 and a P/B ratio of 0.97.
When we divideLennar's P/E ratio by its expected five-year EPS growth rate, we obtain a PEG ratio of 0.74, which indicates that the market is undervaluing the company's projected growth (a PEG ratio of 1 indicates a fairly valued company). Your analysis of the stock shouldn't end here. Rather, a good PEG ratio should alert you that it may be worthwhile to take a closer look at the stock.
EPS Trend Sustained Primarily by Reducing the Number of Shares Outstanding:
| 2020 | 2021 | 2022 | 2023 | 2024 | 2025 | |
|---|---|---|---|---|---|---|
| Revenue (M) | $22,489 | $27,131 | $33,671 | $34,233 | $35,441 | $34,187 |
| Operating Margins | 15% | 21% | 18% | 15% | 15% | 8% |
| Net Margins | 11% | 16% | 14% | 12% | 11% | 6% |
| Net Income (M) | $2,465 | $4,430 | $4,614 | $3,939 | $3,933 | $2,078 |
| Net Interest Expense (M) | $97 | $48 | $68 | $81 | $55 | $50 |
| Depreciation & Amort. (M) | $95 | $86 | $87 | $110 | $116 | $134 |
| Diluted Shares (M) | 309 | 307 | 290 | 283 | 272 | 256 |
| Earnings Per Share | $7.85 | $14.27 | $15.72 | $13.73 | $14.31 | $8.13 |
| EPS Growth | n/a | 81.78% | 10.16% | -12.66% | 4.22% | -43.19% |
| Avg. Price | $62.83 | $95.58 | $82.14 | $149.04 | $136.34 | $87.09 |
| P/E Ratio | 7.97 | 6.69 | 5.22 | 10.86 | 9.53 | 10.91 |
| Free Cash Flow (M) | $4,118 | $2,468 | $3,208 | $5,080 | $2,232 | $28 |
| CAPEX (M) | $73 | $65 | $57 | $100 | $172 | $189 |
| EV / EBITDA | 6.77 | 5.49 | 4.44 | 7.7 | 6.69 | 8.01 |
| Total Debt (M) | $7,422 | $6,651 | $8,095 | $5,633 | $4,189 | $5,875 |
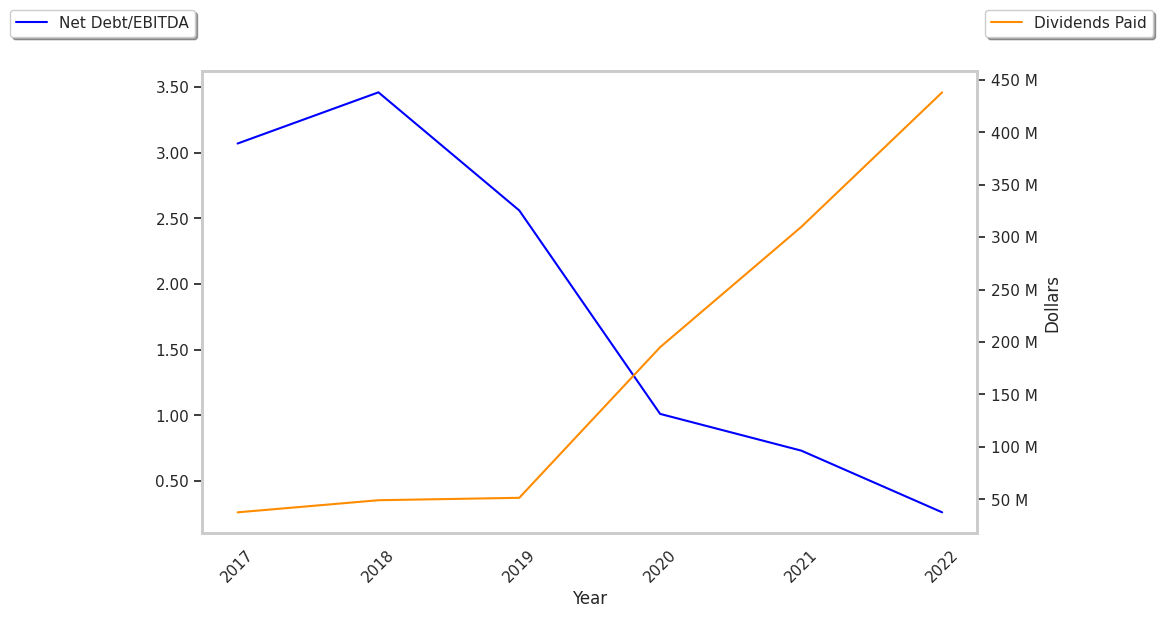
| Net Debt / EBITDA | 1.27 | 0.66 | 0.54 | -0.18 | -0.14 | 0.72 |
Lennar has weak operating margins with a negative growth trend, EPS growth achieved by reducing the number of outstanding shares, and positive cash flows. On the other hand, the company benefits from growing revenues and increasing reinvestment in the business and healthy leverage levels.