Now trading at a price of $39.12, Southwest Airlines has moved -2.2% so far today.
Southwest Airlines returned gains of 27.8% last year, with its stock price reaching a high of $55.11 and a low of $28.98. Over the same period, the stock outperformed the S&P 500 index by 1.9%. More recently, the company's 50-day average price was $40.32. Southwest Airlines Co. operates as a passenger airline company that provides scheduled air transportation services in the United States and internationally. Based in Dallas, TX, the Large-Cap Consumer Discretionary company has 73,401 full time employees. Southwest Airlines has returned a 1.8% dividend yield over the last 12 months, but this may not be sustainable seen that the company has a choppy cash flow record.
Negative Cash Flows:
| 2020 | 2021 | 2022 | 2023 | 2024 | 2025 | |
|---|---|---|---|---|---|---|
| Revenue (M) | $9,048 | $15,790 | $23,814 | $26,091 | $27,483 | $28,063 |
| Operating Margins | -42% | 11% | 4% | 1% | 1% | 2% |
| Net Margins | -34% | 6% | 2% | 2% | 2% | 2% |
| Net Income (M) | -$3,074 | $977 | $539 | $465 | $465 | $441 |
| Net Interest Expense (M) | $349 | $467 | $340 | $259 | $220 | $108 |
| Depreciation & Amort. (M) | $1,255 | $1,272 | $1,351 | $1,522 | $1,657 | $1,560 |
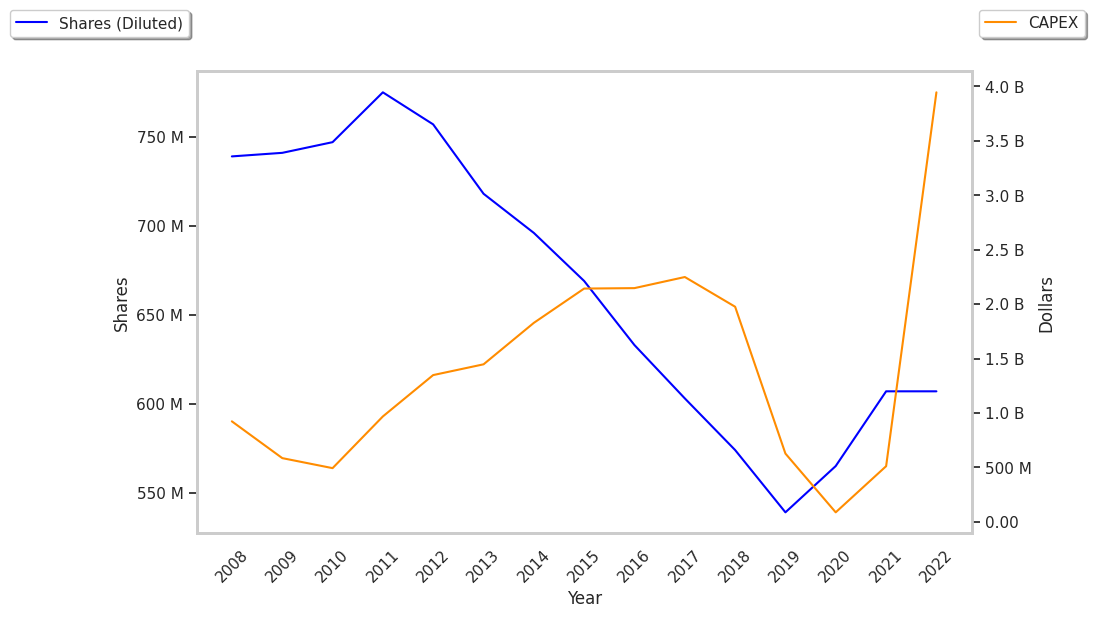
| Diluted Shares (M) | 565 | 609 | 642 | 640 | 643 | 558 |
| Earnings Per Share | -$5.44 | $1.61 | $0.87 | $0.76 | $0.76 | $0.79 |
| EPS Growth | n/a | 129.6% | -45.96% | -12.64% | 0.0% | 3.95% |
| Avg. Price | $39.35 | $51.8 | $42.54 | $28.88 | $33.56 | $39.99 |
| P/E Ratio | -7.23 | 31.39 | 46.75 | 37.03 | 43.03 | 48.77 |
| Free Cash Flow (M) | -$1,642 | $1,817 | -$134 | -$356 | -$1,592 | -$831 |
| CAPEX (M) | $515 | $505 | $3,924 | $3,520 | $2,054 | $2,673 |
| EV / EBITDA | -11.52 | 12.92 | 13.45 | 13.67 | 12.28 | 15.08 |
| Total Debt (M) | $20,222 | $20,548 | $16,143 | $15,990 | $11,766 | $9,506 |
| Net Debt / EBITDA | -3.58 | 2.7 | 2.81 | 3.84 | 2.15 | 3.16 |
| Current Ratio | 2.02 | 1.97 | 1.43 | 1.14 | 0.92 | 0.52 |
Southwest Airlines's Valuation Is in Line With Its Sector Averages:
Southwest Airlines has a trailing twelve month P/E ratio of 26.9, compared to an average of 20.93 for the Consumer Discretionary sector. Based on its EPS guidance of $4.5, the company has a forward P/E ratio of 9.0. The 9.0% compound average growth rate of Southwest Airlines's historical and projected earnings per share yields a PEG ratio of 2.99. This suggests that these shares are overvalued. In contrast, the market is likely undervaluing Southwest Airlines in terms of its equity because its P/B ratio is 2.53 while the sector average is 2.93. The company's shares are currently trading 145.4% below their Graham number.
There's an Analyst Consensus of Some Upside Potential for Southwest Airlines:
The 23 analysts following Southwest Airlines have set target prices ranging from $30.0 to $60.0 per share, for an average of $45.25 with a hold rating.
Southwest Airlines has an average amount of shares sold short because 5.2% of the company's shares are sold short. Institutions own 93.5% of the company's shares, and the insider ownership rate stands at 1.0%, suggesting a small amount of insider investors. The largest shareholder is Elliott Investment Management L.P., whose 10% stake in the company is worth $2,000,146,865.