Now trading at a price of $167.28, Cincinnati Financial has moved 1.2% so far today.
Cincinnati Financial returned gains of 9.6% last year, with its stock price reaching a high of $174.27 and a low of $143.37. Over the same period, the stock underperformed the S&P 500 index by -16.3%. The company's 50-day average price was $162.28. Cincinnati Financial Corporation provides property casualty insurance products in the United States. Based in Fairfield, OH, the Large-Cap Finance company has 5,705 full time employees. Cincinnati Financial has offered a 2.1% dividend yield over the last 12 months.
Generally Positive Cash Flows and Good EPS Growth:
| 2020 | 2021 | 2022 | 2023 | 2024 | 2025 | |
|---|---|---|---|---|---|---|
| Revenue (M) | $7,536 | $9,626 | $6,563 | $10,013 | $11,337 | $12,631 |
| Interest Income (M) | $54 | $53 | $53 | $54 | $53 | $53 |
| Operating Margins | 20% | 38% | -11% | 23% | 25% | 24% |
| Net Margins | 16% | 31% | -7% | 18% | 20% | 19% |
| Net Income (M) | $1,216 | $2,968 | -$487 | $1,843 | $2,292 | $2,393 |
| Depreciation & Amort. (M) | $33 | $33 | $33 | $30 | $34 | $36 |
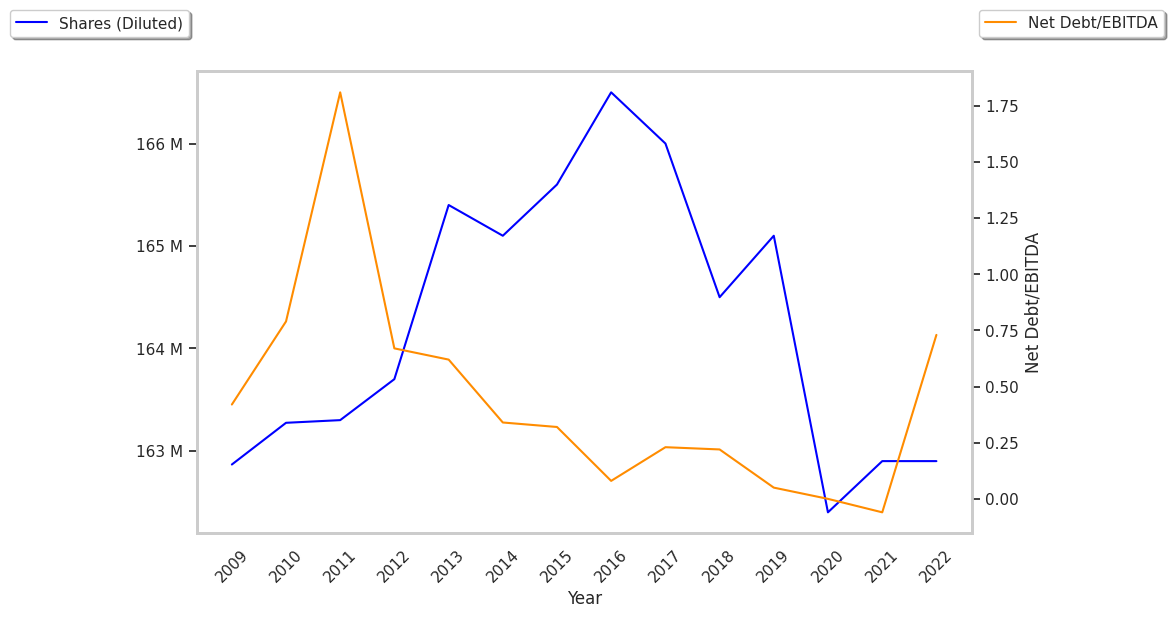
| Diluted Shares (M) | 162 | 163 | 159 | 158 | 158 | 158 |
| Earnings Per Share | $7.49 | $18.24 | -$3.06 | $11.66 | $14.53 | $15.17 |
| EPS Growth | n/a | 143.52% | -116.78% | 481.05% | 24.61% | 4.4% |
| Avg. Price | $74.47 | $106.67 | $120.42 | $103.46 | $143.21 | $163.33 |
| P/E Ratio | 9.86 | 5.79 | -39.35 | 8.81 | 9.78 | 10.66 |
| Free Cash Flow (M) | $1,471 | $1,966 | $2,037 | $2,034 | $2,627 | $3,092 |
| CAPEX (M) | $20 | $15 | $15 | $18 | $22 | $20 |
| EV / EBITDA | 7.84 | 4.51 | -28.51 | 7.0 | 7.69 | 8.26 |
| Total Debt (M) | $788 | $789 | $789 | $790 | $790 | $790 |
| Net Debt / EBITDA | -0.07 | -0.09 | 0.72 | -0.05 | -0.07 | -0.21 |
Cincinnati Financial has generally positive cash flows and low leverage levels. Additionally, the company's financial statements display growing revenues and a flat capital expenditure trend and a strong EPS growth trend. Furthermore, Cincinnati Financial has decent operating margins with a stable trend.
Cincinnati Financial's Valuation Is in Line With Its Sector Averages:
Cincinnati Financial has a trailing twelve month P/E ratio of 9.3, compared to an average of 15.92 for the Finance sector. Based on its EPS guidance of $9.18, the company has a forward P/E ratio of 17.7. The 3.0% compound average growth rate of Cincinnati Financial's historical and projected earnings per share yields a PEG ratio of 3.14. This suggests that these shares are overvalued. In contrast, the market is likely undervaluing Cincinnati Financial in terms of its equity because its P/B ratio is 1.65 while the sector average is 1.78. The company's shares are currently trading -9.9% above their Graham number.
Cincinnati Financial Has an Analyst Consensus of Some Upside Potential:
The 6 analysts following Cincinnati Financial have set target prices ranging from $161.0 to $191.0 per share, for an average of $179.17 with a buy rating.
Cincinnati Financial has an average amount of shares sold short because 2.1% of the company's shares are sold short. Institutions own 72.8% of the company's shares, and the insider ownership rate stands at 1.71%, suggesting a large amount of insider shareholders. The largest shareholder is Blackrock Inc., whose 8% stake in the company is worth $2,109,594,494.