Capital One Financial logged a 0.7% change during today's evening session, and is now trading at a price of $187.14 per share.
Capital One Financial returned losses of -5.8% last year, with its stock price reaching a high of $259.64 and a low of $174.98. Over the same period, the stock underperformed the S&P 500 index by -31.7%. AThe company's 50-day average price was $188.71. Capital One Financial Corporation operates as the financial services holding company for the Capital One, National Association, which engages in the provision of various financial products and services in the United States, Canada, and the United Kingdom. Based in McLean, VA, the Large-Cap Finance company has 77,100 full time employees. Capital One Financial has offered a 1.5% dividend yield over the last 12 months.
Increasing Revenues but Narrowing Margins:
| 2020 | 2021 | 2022 | 2023 | 2024 | 2025 | |
|---|---|---|---|---|---|---|
| Revenue (M) | $28,523 | $30,435 | $34,250 | $36,787 | $39,112 | $53,434 |
| Interest Income (M) | $22,913 | $24,171 | $27,114 | $29,241 | $31,208 | $42,878 |
| Operating Margins | 11% | 52% | 27% | 16% | 15% | 4% |
| Net Margins | 10% | 41% | 21% | 13% | 12% | 5% |
| Net Income (M) | $2,714 | $12,390 | $7,360 | $4,887 | $4,750 | $2,453 |
| Depreciation & Amort. (M) | $3,501 | $3,481 | $3,210 | $3,226 | $3,237 | $5,260 |
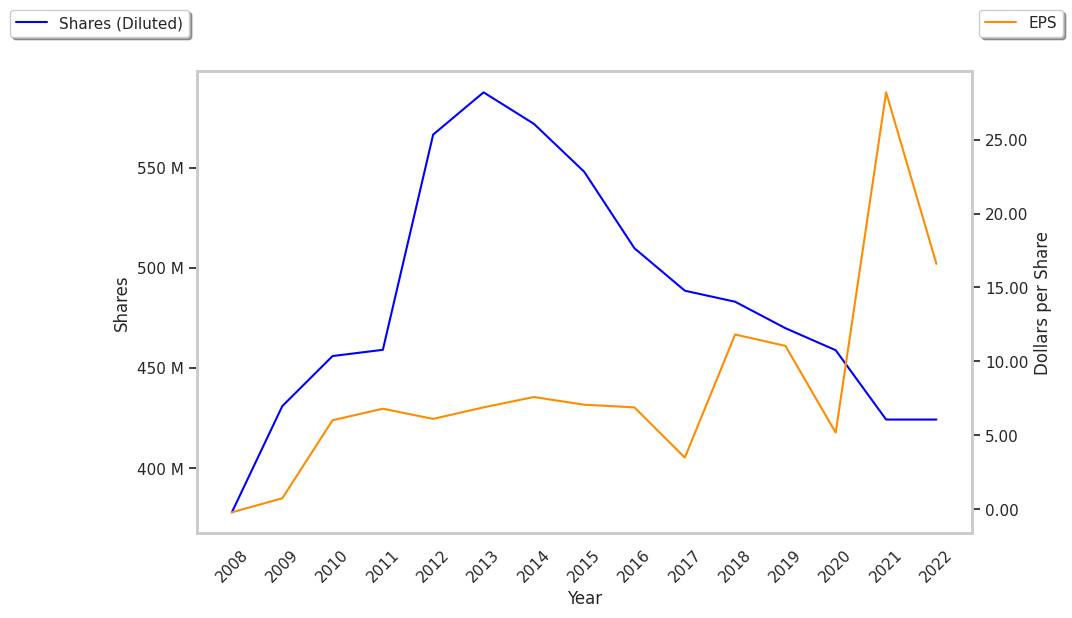
| Diluted Shares (M) | 459 | 444 | 393 | 383 | 384 | 541 |
| Earnings Per Share | $5.18 | $26.94 | $17.91 | $11.95 | $11.59 | $4.03 |
| EPS Growth | n/a | 420.08% | -33.52% | -33.28% | -3.01% | -65.23% |
| Avg. Price | $71.55 | $141.14 | $129.38 | $131.12 | $177.88 | $183.93 |
| P/E Ratio | 13.79 | 5.22 | 7.2 | 10.94 | 15.32 | 45.64 |
| Free Cash Flow (M) | $15,989 | $11,612 | $12,875 | $19,614 | $16,955 | $26,140 |
| CAPEX (M) | $710 | $698 | $934 | $961 | $1,204 | $1,578 |
| EV / EBITDA | 4.74 | 4.41 | 5.63 | 5.99 | 7.54 | 7.69 |
| Total Debt (M) | $39,871 | $42,266 | $47,832 | $49,318 | $44,989 | $49,913 |
| Net Debt / EBITDA | -0.13 | 1.05 | 1.33 | 0.6 | 0.14 | -1.62 |
Capital One Financial has rapidly growing revenues and increasing reinvestment in the business, generally positive cash flows, and low leverage levels. However, the firm suffers from weak net margins with a negative growth trend and declining EPS growth.
a Lower P/B Ratio Than Its Sector Average but Priced at a Premium:
Capital One Financial has a trailing twelve month P/E ratio of 58.1, compared to an average of 15.92 for the Finance sector. Based on its EPS guidance of $24.14, the company has a forward P/E ratio of 7.8. Capital One Financial's PEG ratio is 3.82 on the basis of the 15.2% weighted average of the company and the broader market's EPS compound average growth rates. This suggests that the company's shares are overvalued. In contrast, the market is likely undervaluing Capital One Financial in terms of its equity because its P/B ratio is 1.08 while the sector average is 1.78. The company's shares are currently trading 35.6% below their Graham number.
Capital One Financial Has an Average Rating of Buy:
The 21 analysts following Capital One Financial have set target prices ranging from $215.0 to $310.0 per share, for an average of $255.19 with a buy rating.
Capital One Financial has a very low short interest because 1.5% of the company's shares are sold short. Institutions own 85.5% of the company's shares, and the insider ownership rate stands at 1.88%, suggesting a large amount of insider shareholders. The largest shareholder is Blackrock Inc., whose 8% stake in the company is worth $9,510,122,782.