A strong performer from today's morning trading session is CoStar, whose shares rose 2.5% to $32.64 per share. For those of you thinking about investing in the stock, here is a brief value analysis of the stock using the company's basic fundamental ratios.
CoStar's Valuation Is in Line With Its Sector Averages:
CoStar Group, Inc. provides information, analytics, and online marketplace services to real estate and related business communities in the United States, Australia, Canada, Europe, the Asia Pacific, and Latin America. The company belongs to the Finance sector, which has an average price to earnings (P/E) ratio of 15.92 and an average price to book (P/B) ratio of 1.78. In contrast, CoStar has a trailing 12 month P/E ratio of 466.3 and a P/B ratio of 1.68.
When we divideCoStar's P/E ratio by its expected five-year EPS growth rate, we obtain a PEG ratio of 0.12, which indicates that the market is undervaluing the company's projected growth (a PEG ratio of 1 indicates a fairly valued company). Your analysis of the stock shouldn't end here. Rather, a good PEG ratio should alert you that it may be worthwhile to take a closer look at the stock.
Increasing Revenues but Narrowing Margins:
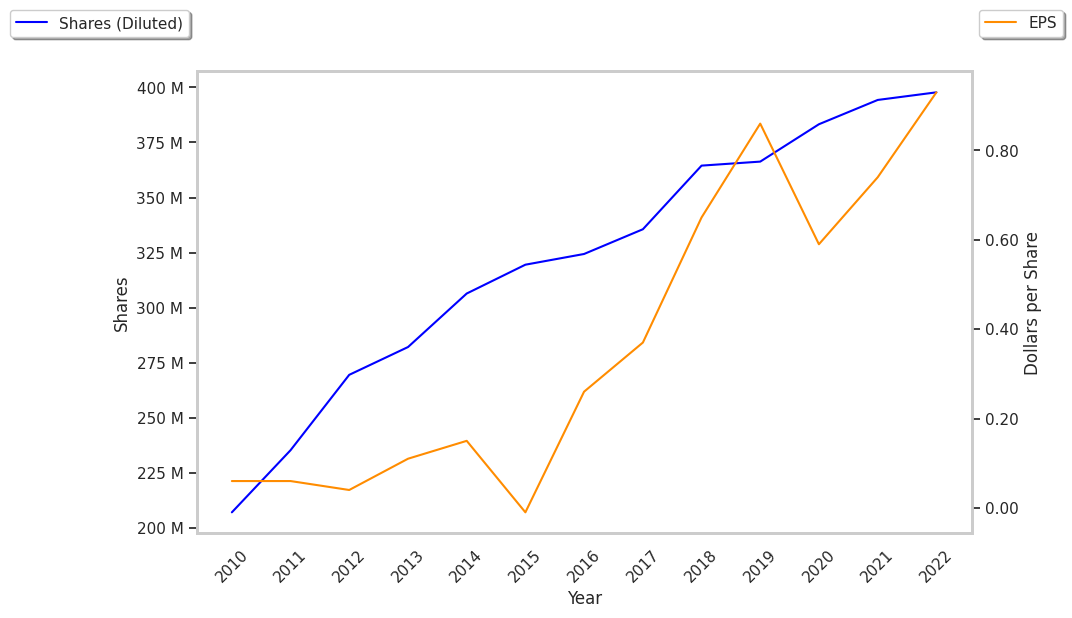
| 2020 | 2021 | 2022 | 2023 | 2024 | 2025 | |
|---|---|---|---|---|---|---|
| Revenue (M) | $1,659 | $1,944 | $2,182 | $2,455 | $2,736 | $3,247 |
| Interest Income (M) | -$17 | -$32 | $32 | $214 | $213 | $110 |
| Operating Margins | 17% | 22% | 21% | 11% | 0% | -2% |
| Net Margins | 14% | 15% | 17% | 15% | 5% | 0% |
| Net Income (M) | $227 | $293 | $370 | $375 | $139 | $7 |
| Depreciation & Amort. (M) | $29 | $29 | $29 | $34 | $57 | $64 |
| Diluted Shares (M) | 383 | 394 | 398 | 407 | 408 | 421 |
| Earnings Per Share | $0.59 | $0.74 | $0.93 | $0.92 | $0.34 | $0.02 |
| EPS Growth | n/a | 25.42% | 25.68% | -1.08% | -63.04% | -94.12% |
| Avg. Price | $74.41 | $85.77 | $63.41 | $87.39 | $71.11 | $32.92 |
| P/E Ratio | 120.02 | 115.91 | 67.46 | 94.99 | 209.15 | 1646.0 |
| Free Cash Flow (M) | $486 | $346 | $444 | $372 | -$186 | $123 |
| CAPEX (M) | n/a | $124 | $35 | $118 | $579 | $307 |
| EV / EBITDA | 77.27 | 67.21 | 43.84 | 99.2 | 409.05 | -1501.04 |
| Total Debt (M) | $1,000 | $1,000 | $1,000 | $1,000 | $1,000 | $140 |
| Net Debt / EBITDA | -8.47 | -6.07 | -8.33 | -13.29 | -59.37 | 186.62 |
| Current Ratio | 11.75 | 11.78 | 13.91 | 12.01 | 8.97 | 2.84 |
CoStar has rapidly growing revenues and increasing reinvestment in the business, an excellent current ratio of 2.84, and low debt levels. However, the firm suffers from declining EPS growth and positive cash flows.