Now trading at a price of $135.99, D.R. Horton has moved -2.4% so far today.
D.R. Horton returned gains of 10.8% last year, with its stock price reaching a high of $184.55 and a low of $114.17. Over the same period, the stock underperformed the S&P 500 index by -15.1%. The company's 50-day average price was $144.91. D.R. Horton, Inc. operates as a homebuilding company in East, North, Southeast, South Central, Southwest, and Northwest regions in the United States. Based in Arlington, TX, the Large-Cap Consumer Discretionary company has 14,341 full time employees. D.R. Horton has offered a 1.2% dividend yield over the last 12 months.
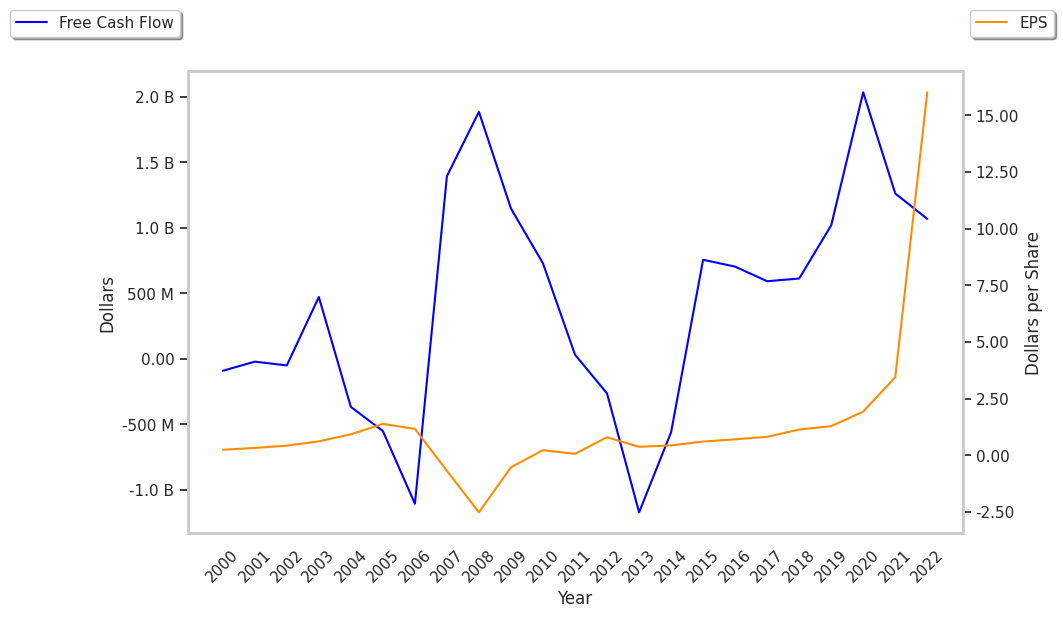
Growing Revenues and Healthy Leverage Levels:
| 2020 | 2021 | 2022 | 2023 | 2024 | 2025 | |
|---|---|---|---|---|---|---|
| Revenue (M) | $20,311 | $27,774 | $33,480 | $35,460 | $36,801 | $34,250 |
| Operating Margins | 15% | 19% | 23% | 18% | 17% | 14% |
| Net Margins | 12% | 15% | 17% | 13% | 13% | 10% |
| Net Income (M) | $2,374 | $4,176 | $5,858 | $4,746 | $4,756 | $3,585 |
| Net Interest Expense (M) | $153 | $152 | $162 | $204 | $204 | $242 |
| Depreciation & Amort. (M) | $69 | $73 | $72 | $83 | $78 | $91 |
| Diluted Shares (M) | 370 | 360 | 347 | 336 | 323 | 293 |
| Earnings Per Share | $6.41 | $11.41 | $16.51 | $13.82 | $14.34 | $11.57 |
| EPS Growth | n/a | 78.0% | 44.7% | -16.29% | 3.76% | -19.32% |
| Avg. Price | $58.7 | $88.42 | $77.19 | $151.98 | $139.85 | $144.96 |
| P/E Ratio | 9.04 | 7.65 | 4.64 | 10.91 | 9.68 | 12.48 |
| Free Cash Flow (M) | $1,325 | $441 | $414 | $4,156 | $2,024 | $3,284 |
| CAPEX (M) | $96 | $94 | $148 | $149 | $165 | $137 |
| EV / EBITDA | 8.11 | 6.73 | 4.21 | 8.59 | 7.9 | 10.01 |
| Total Debt (M) | $5,812 | $7,440 | $8,453 | $7,614 | $8,395 | $8,532 |
| Net Debt / EBITDA | 1.1 | 0.92 | 0.76 | 0.67 | 0.84 | 1.25 |
D.R. Horton has growing revenues and increasing reinvestment in the business and generally positive cash flows. Additionally, the company's financial statements display a strong EPS growth trend and healthy leverage levels. Furthermore, D.R. Horton has decent operating margins with a stable trend.
D.R. Horton Has Attractive Multiples and Trades Below Its Fair Value:
D.R. Horton has a trailing twelve month P/E ratio of 13.6, compared to an average of 20.93 for the Consumer Discretionary sector. Based on its EPS guidance of $12.04, the company has a forward P/E ratio of 12.0. The 9.4% compound average growth rate of D.R. Horton's historical and projected earnings per share yields a PEG ratio of 1.44. This implies that the shares are fairly valued. In contrast, the market is likely undervaluing D.R. Horton in terms of its equity because its P/B ratio is 1.64 while the sector average is 2.93. The company's shares are currently trading -6.8% above their Graham number.
D.R. Horton Has an Average Rating of Hold:
The 14 analysts following D.R. Horton have set target prices ranging from $123.0 to $206.0 per share, for an average of $165.29 with a hold rating.
D.R. Horton has an average amount of shares sold short because 6.3% of the company's shares are sold short. Institutions own 87.6% of the company's shares, and the insider ownership rate stands at 11.61%, suggesting a large amount of insider shareholders. The largest shareholder is Capital World Investors, whose 13% stake in the company is worth $5,022,941,257.