A strong performer from today's evening trading session is Henry Schein, whose shares rose 2.4% to $75.67 per share. For those of you thinking about investing in the stock, here is a brief value analysis of the stock using the company's basic fundamental ratios.
an Increase in Expected Earnings Improves Its Value Outlook but Priced at a Premium:
Henry Schein, Inc. provides health care products and services to office-based dental and medical practitioners worldwide. The company belongs to the Health Care sector, which has an average price to earnings (P/E) ratio of 22.94 and an average price to book (P/B) ratio of 3.19. In contrast, Henry Schein has a trailing 12 month P/E ratio of 22.9 and a P/B ratio of 2.65.
Henry Schein's PEG ratio is 1.63, which shows that the stock is probably overvalued in terms of its estimated growth. For reference, a PEG ratio near or below 1 is a potential signal that a company is undervalued.
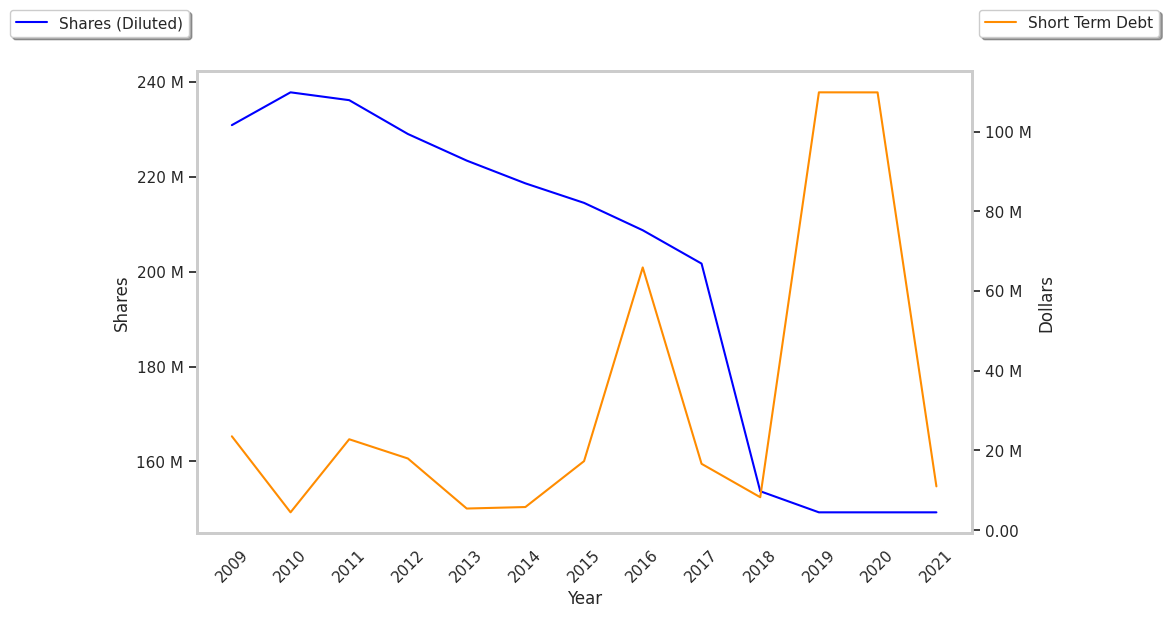
EPS Trend Sustained Primarily by Reducing the Number of Shares Outstanding:
| 2020 | 2021 | 2022 | 2023 | 2024 | 2025 | |
|---|---|---|---|---|---|---|
| Revenue (M) | $10,119 | $12,401 | $12,647 | $12,339 | $12,673 | $13,184 |
| Gross Margins | 28% | 30% | 30% | 31% | 32% | 31% |
| Net Margins | 4% | 5% | 4% | 3% | 3% | 3% |
| Net Income (M) | $404 | $631 | $566 | $416 | $390 | $398 |
| Net Interest Expense (M) | $41 | $27 | $47 | $87 | $131 | $150 |
| Depreciation & Amort. (M) | $64 | $71 | $68 | $70 | $83 | $101 |
| Diluted Shares (M) | 143 | 142 | 138 | 132 | 128 | 122 |
| Earnings Per Share | $2.82 | $4.45 | $3.91 | $3.16 | $3.05 | $3.27 |
| EPS Growth | n/a | 57.8% | -12.13% | -19.18% | -3.48% | 7.21% |
| Avg. Price | $62.01 | $74.18 | $82.4 | $75.71 | $68.89 | $73.5 |
| P/E Ratio | 21.91 | 16.45 | 21.07 | 23.81 | 22.44 | 22.34 |
| Free Cash Flow (M) | $550 | $631 | $506 | $353 | $700 | $573 |
| CAPEX (M) | $49 | $79 | $96 | $147 | $148 | $139 |
| EV / EBITDA | 15.19 | 12.22 | 15.02 | 17.31 | 15.08 | 15.01 |
| Total Debt (M) | $626 | $833 | $1,052 | $2,087 | $1,886 | $2,343 |
| Net Debt / EBITDA | 0.34 | 0.77 | 1.15 | 2.8 | 2.51 | 2.9 |
| Current Ratio | 1.66 | 1.67 | 1.79 | 1.67 | 1.42 | 1.38 |
Henry Schein has positive cash flows, just enough current assets to cover current liabilities, as shown by its current ratio of 1.38, and significant leverage levels. We also note that the company has growing revenues and increasing reinvestment in the business working in its favor. However, the firm suffers from slimmer gross margins than its peers and EPS growth achieved by reducing the number of outstanding shares.