It hasn't been a great evening session for Loews investors, who have watched their shares sink by -2.0% to a price of $104.83. Some of you might be wondering if it's time to buy the dip. If you are considering this, make sure to check the company's fundamentals first to determine if the shares are fairly valued at today's prices.
Loews Is Potentially Undervalued and Trades Below Its Graham Number:
Loews Corporation, through its subsidiaries, provides commercial property and casualty insurance in the United States and internationally. The company belongs to the Finance sector, which has an average price to earnings (P/E) ratio of 15.92 and an average price to book (P/B) ratio of 1.78. In contrast, Loews has a trailing 12 month P/E ratio of 13.3 and a P/B ratio of 1.15.
Loews's PEG ratio is 1.32, which shows that the stock is probably overvalued in terms of its estimated growth. For reference, a PEG ratio near or below 1 is a potential signal that a company is undervalued.
Exceptional EPS Growth but Not Enough Current Assets to Cover Current Liabilities:
| 2020 | 2021 | 2022 | 2023 | 2024 | 2025 | |
|---|---|---|---|---|---|---|
| Revenue (M) | $12,583 | $14,657 | $14,044 | $15,901 | $17,510 | $18,454 |
| Interest Income (M) | $515 | $424 | $378 | $376 | $441 | $437 |
| Operating Margins | -12% | 15% | 8% | 13% | 11% | 12% |
| Net Margins | -7% | 11% | 6% | 9% | 8% | 9% |
| Net Income (M) | -$931 | $1,562 | $822 | $1,434 | $1,414 | $1,667 |
| Depreciation & Amort. (M) | $734 | $515 | $509 | $538 | $583 | $610 |
| Diluted Shares (M) | 280 | 260 | 243 | 228 | 221 | 209 |
| Earnings Per Share | -$3.32 | $6.0 | $3.38 | $6.29 | $6.41 | $7.97 |
| EPS Growth | n/a | 280.72% | -43.67% | 86.09% | 1.91% | 24.34% |
| Avg. Price | $38.64 | $53.54 | $61.65 | $69.59 | $84.58 | $109.18 |
| P/E Ratio | -11.64 | 8.89 | 18.19 | 11.05 | 13.17 | 13.68 |
| Free Cash Flow (M) | $1,035 | $2,141 | $2,654 | $3,221 | $2,393 | $2,700 |
| CAPEX (M) | $710 | $482 | $660 | $686 | $632 | $579 |
| EV / EBITDA | -28.43 | 8.48 | 14.66 | 9.85 | 11.07 | 11.14 |
| Total Debt (M) | $10,109 | $9,018 | $9,019 | $9,003 | $8,944 | $9,489 |
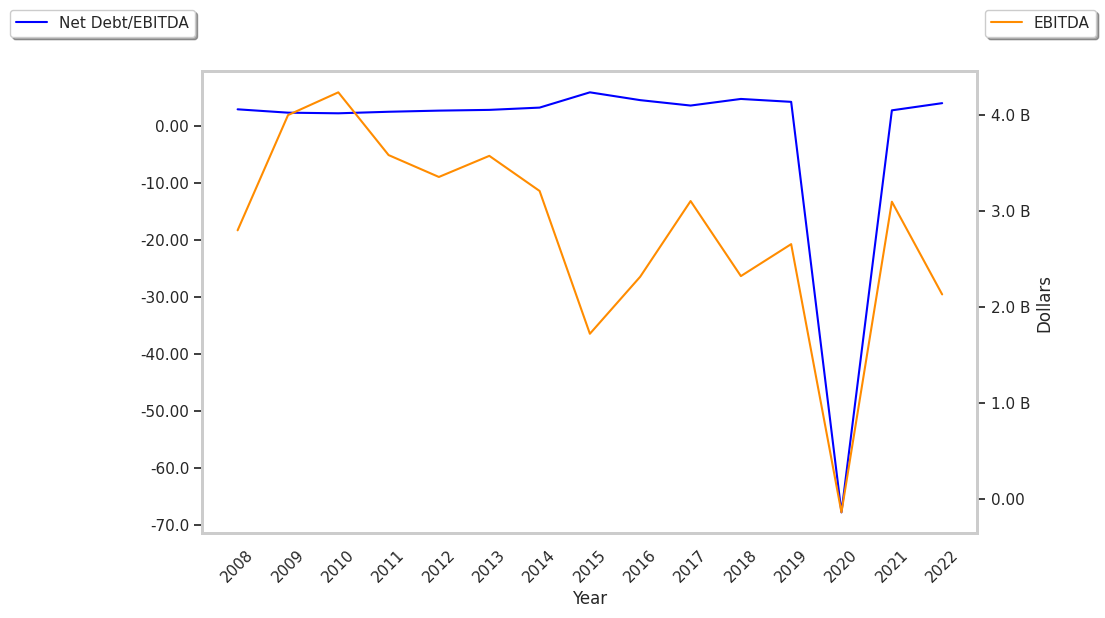
| Net Debt / EBITDA | -13.19 | 3.14 | 5.23 | 3.4 | 3.42 | 3.11 |
| Current Ratio | 126.32 | 52.26 | 5.68 | 0.37 | 108.2 | 0.47 |
Loews has exceptional EPS growth, generally positive cash flows, and growing revenues and a flat capital expenditure trend. However, the firm has not enough current assets to cover current liabilities because its current ratio is 0.47. Finally, we note that Loews has weak operating margins with a positive growth rate and significant leverage levels.