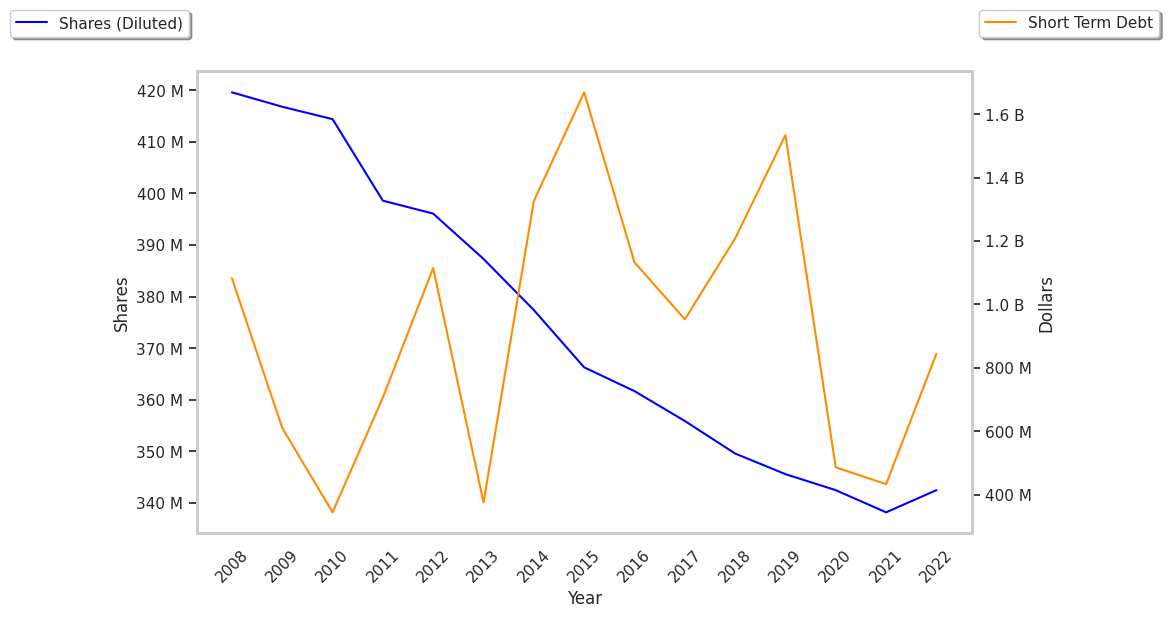
Kimberly-Clark shares fell by -2.5% during the day's evening session, and are now trading at a price of $97.6. Is it time to buy the dip? To better answer that question, it's essential to check if the market is valuing the company's shares fairly in terms of its earnings and equity levels.
an Increase in Expected Earnings Improves Its Value Outlook but Trades Above Its Graham Number:
Kimberly-Clark Corporation, together with its subsidiaries, manufactures and markets personal care products in the United States. The company belongs to the Consumer Discretionary sector, which has an average price to earnings (P/E) ratio of 20.93 and an average price to book (P/B) ratio of 2.93. In contrast, Kimberly-Clark has a trailing 12 month P/E ratio of 18.9 and a P/B ratio of 18.04.
Kimberly-Clark's PEG ratio is 2.02, which shows that the stock is probably overvalued in terms of its estimated growth. For reference, a PEG ratio near or below 1 is a potential signal that a company is undervalued.
The Company's Revenues Are Declining:
| 2020 | 2021 | 2022 | 2023 | 2024 | 2025 | |
|---|---|---|---|---|---|---|
| Revenue (M) | $19,140 | $19,440 | $16,952 | $17,146 | $16,805 | $16,447 |
| Gross Margins | 36% | 31% | 33% | 37% | 37% | 36% |
| Net Margins | 12% | 9% | 11% | 10% | 15% | 12% |
| Net Income (M) | $2,352 | $1,814 | $1,934 | $1,764 | $2,545 | $2,021 |
| Net Interest Expense (M) | $252 | $256 | $282 | $293 | $270 | $256 |
| Depreciation & Amort. (M) | $796 | $766 | $617 | $627 | $641 | $735 |
| Diluted Shares (M) | 342 | 339 | 338 | 339 | 337 | 333 |
| Earnings Per Share | $6.87 | $5.35 | $5.72 | $5.21 | $7.55 | $6.07 |
| EPS Growth | n/a | -22.13% | 6.92% | -8.92% | 44.91% | -19.6% |
| Avg. Price | $127.64 | $124.85 | $126.0 | $121.51 | $130.35 | $98.73 |
| P/E Ratio | 18.5 | 23.21 | 21.99 | 23.28 | 17.2 | 16.21 |
| Free Cash Flow (M) | $2,512 | $1,723 | $1,857 | $2,776 | $2,513 | $1,639 |
| CAPEX (M) | $1,217 | $1,007 | $876 | $766 | $721 | $1,138 |
| EV / EBITDA | 12.79 | 15.19 | 17.3 | 18.8 | 15.07 | 12.76 |
| Total Debt (M) | $8,364 | $8,574 | $8,422 | $7,949 | $7,418 | $7,168 |
| Net Debt / EBITDA | 2.0 | 2.5 | 2.73 | 2.69 | 1.92 | 2.1 |
| Current Ratio | 0.8 | 0.82 | 0.78 | 0.82 | 0.8 | 0.75 |
Kimberly-Clark has declining revenues and a flat capital expenditure trend, declining EPS growth, and not enough current assets to cover current liabilities because its current ratio is 0.75. On the other hand, the company benefits from wider gross margins than its peer group and healthy leverage levels. Furthermore, Kimberly-Clark has positive cash flows.