It's been a great morning session for Omnicom investors, who saw their shares rise 2.9% to a price of $74.85 per share. At these higher prices, is the company still fairly valued? If you are thinking about investing, make sure to check the company's fundamentals before making a decision.
Omnicom's Valuation Is in Line With Its Sector Averages:
Omnicom Group Inc., together with its subsidiaries, offers advertising, marketing, and corporate communications services. The company belongs to the Consumer Discretionary sector, which has an average price to earnings (P/E) ratio of 20.93 and an average price to book (P/B) ratio of 2.93. In contrast, Omnicom has a trailing 12 month P/E ratio of -202.3 and a P/B ratio of 2.26.
Omnicom's PEG ratio is 15.97, which shows that the stock is probably overvalued in terms of its estimated growth. For reference, a PEG ratio near or below 1 is a potential signal that a company is undervalued.
The Business Is Unprofitable and Its Balance Sheet Is Highly Leveraged:
| 2020 | 2021 | 2022 | 2023 | 2024 | 2025 | |
|---|---|---|---|---|---|---|
| Revenue (M) | $13,171 | $14,289 | $14,289 | $14,692 | $15,689 | $17,272 |
| Gross Margins | 17% | 20% | 19% | 18% | 19% | 8% |
| Net Margins | 7% | 10% | 9% | 9% | 9% | 0% |
| Net Income (M) | $945 | $1,408 | $1,316 | $1,391 | $1,481 | -$54 |
| Net Interest Expense (M) | $222 | $236 | $209 | $218 | $248 | $263 |
| Depreciation & Amort. (M) | $140 | $132 | $139 | $131 | $136 | $145 |
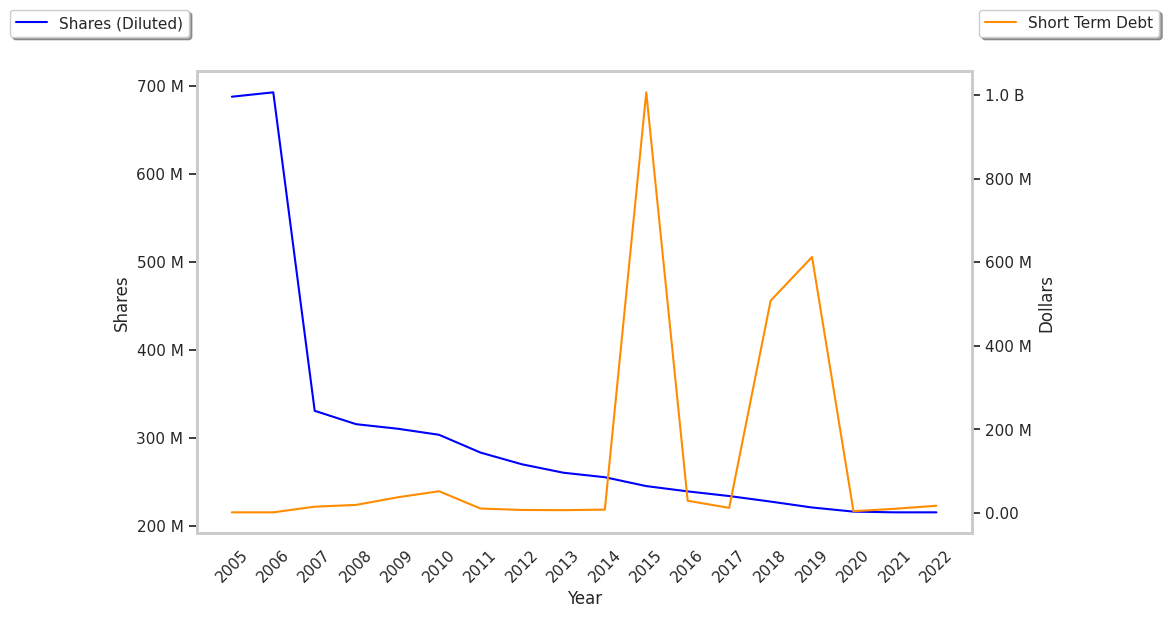
| Diluted Shares (M) | 216 | 216 | 207 | 201 | 199 | 205 |
| Earnings Per Share | $4.37 | $6.53 | $6.36 | $6.91 | $7.46 | -$0.27 |
| EPS Growth | n/a | 49.43% | -2.6% | 8.65% | 7.96% | -103.62% |
| Avg. Price | $52.36 | $68.58 | $73.16 | $86.51 | $85.86 | $73.77 |
| P/E Ratio | 11.95 | 10.44 | 11.43 | 12.39 | 11.39 | -273.22 |
| Free Cash Flow (M) | $1,649 | $1,280 | $848 | $1,344 | $1,593 | $2,788 |
| CAPEX (M) | $75 | $666 | $78 | $78 | $141 | $150 |
| EV / EBITDA | 6.66 | 6.51 | 7.49 | 8.4 | 7.78 | 28.74 |
| Total Debt (M) | $5,827 | $5,737 | $5,629 | $5,681 | $6,094 | $9,335 |
| Net Debt / EBITDA | 0.13 | 0.18 | 0.61 | 0.56 | 0.73 | 4.16 |
| Current Ratio | 1.0 | 0.98 | 0.97 | 0.95 | 1.0 | 0.93 |
Omnicom's financial statements include several red flags such as slimmer gross margins than its peers, declining EPS growth, and not enough current assets to cover current liabilities because its current ratio is 0.93. Additionally, the firm has a highly leveraged balance sheet. On the other hand, the company has generally positive cash flows working in its favor. Furthermore, Omnicom has growing revenues and decreasing reinvestment in the business.