M&T Bank may be undervalued with strong growth indicators, but the 18 analysts following the company give it an rating of hold. Their target prices range from $205.0 to $265.0 per share, for an average of $233.17. At today's price of $217.31, M&T Bank is trading -6.8% away from its average target price, suggesting there is an analyst consensus of some upside potential for the stock.
M&T Bank Corporation operates as a bank holding company for Manufacturers and Traders Trust Company and Wilmington Trust, National Association that provides retail and commercial banking products and services in the United States. Based in Buffalo, NY, the Large-Cap Finance company has 21,866 full time employees. M&T Bank has provided a 2.8% dividend yield over the last 12 months.
M&T Bank has a trailing twelve month P/E ratio of 12.2, compared to an average of 15.92 for the Finance sector. Considering its EPS guidance of $20.86, the company has a forward P/E ratio of 10.4.
Furthermore, the market is potentially undervaluing M&T Bank in terms of its book value because its P/B ratio is 1.25. In comparison, the sector average P/B ratio is 1.78. The company's shares are currently -18.0% above their Graham number, which suggests that they are not trading at a fair value in terms of earnings and net assets.
| 2020 | 2021 | 2022 | 2023 | 2024 | 2025 | |
|---|---|---|---|---|---|---|
| Revenue (M) | $5,955 | $5,992 | $8,179 | $9,643 | $11,026 | $10,486 |
| Interest Income (M) | $3,866 | $3,825 | $5,822 | $7,115 | $6,852 | $6,948 |
| Operating Margins | 30% | 41% | 32% | 38% | 30% | 35% |
| Net Margins | 23% | 31% | 24% | 28% | 23% | 27% |
| Net Income (M) | $1,353 | $1,859 | $1,992 | $2,741 | $2,588 | $2,851 |
| Depreciation & Amort. (M) | $15 | $10 | $282 | $77 | $316 | $323 |
| Diluted Shares (M) | 129 | 129 | 164 | 167 | 167 | 159 |
| Earnings Per Share | $9.94 | $13.8 | $11.53 | $15.79 | $14.64 | $17.0 |
| EPS Growth | n/a | 38.83% | -16.45% | 36.95% | -7.28% | 16.12% |
| Avg. Price | $106.1 | $139.96 | $164.91 | $137.08 | $187.72 | $212.33 |
| P/E Ratio | 10.67 | 10.13 | 14.23 | 8.65 | 12.76 | 12.42 |
| Free Cash Flow (M) | $617 | $2,566 | $4,360 | $3,649 | $3,394 | $2,860 |
| CAPEX (M) | $172 | $149 | $214 | $256 | $216 | $143 |
| EV / EBITDA | 9.34 | 8.17 | -0.43 | 0.38 | 6.37 | 6.73 |
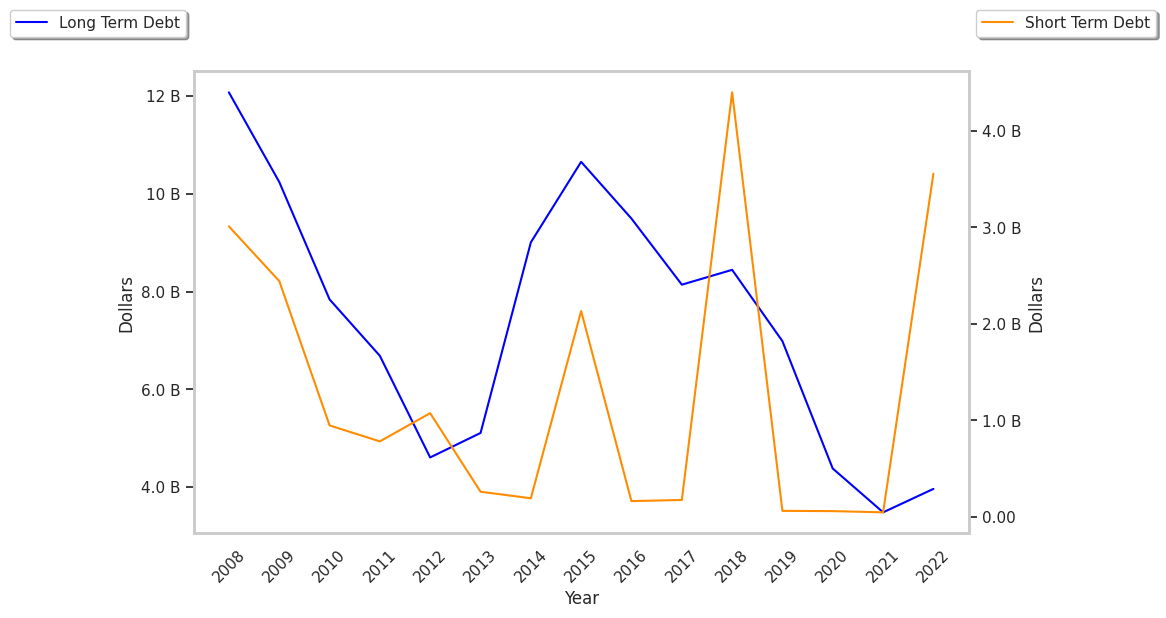
| Total Debt (M) | $4,382 | $3,485 | $3,965 | $8,201 | $12,605 | $10,911 |
| Net Debt / EBITDA | 1.59 | 0.87 | -7.78 | -5.84 | -2.26 | -1.96 |