It hasn't been a great morning session for Alnylam Pharmaceuticals investors, who have watched their shares sink by -5.3% to a price of $287.0. Some of you might be wondering if it's time to buy the dip. If you are considering this, make sure to check the company's fundamentals first to determine if the shares are fairly valued at today's prices.
Alnylam Pharmaceuticals's Valuation Is in Line With Its Sector Averages:
Alnylam Pharmaceuticals, Inc. discovers, develops, manufactures, and commercializes therapeutics based on ribonucleic acid interference in the United States, Europe, and internationally. The company belongs to the Health Care sector, which has an average price to earnings (P/E) ratio of 22.94 and an average price to book (P/B) ratio of 3.19. In contrast, Alnylam Pharmaceuticals has a trailing 12 month P/E ratio of 72.3 and a P/B ratio of 35.61.
When we divideAlnylam Pharmaceuticals's P/E ratio by its expected five-year EPS growth rate, we obtain a PEG ratio of 0.52, which indicates that the market is undervaluing the company's projected growth (a PEG ratio of 1 indicates a fairly valued company). Your analysis of the stock shouldn't end here. Rather, a good PEG ratio should alert you that it may be worthwhile to take a closer look at the stock.
An Excellent Current Ratio but Negative Cash Flows:
| 2020 | 2021 | 2022 | 2023 | 2024 | 2025 | |
|---|---|---|---|---|---|---|
| Revenue (M) | $493 | $844 | $1,037 | $1,828 | $2,248 | $3,714 |
| Operating Margins | -168% | -84% | -76% | -15% | -8% | 14% |
| Net Margins | -174% | -101% | -109% | -24% | -12% | 8% |
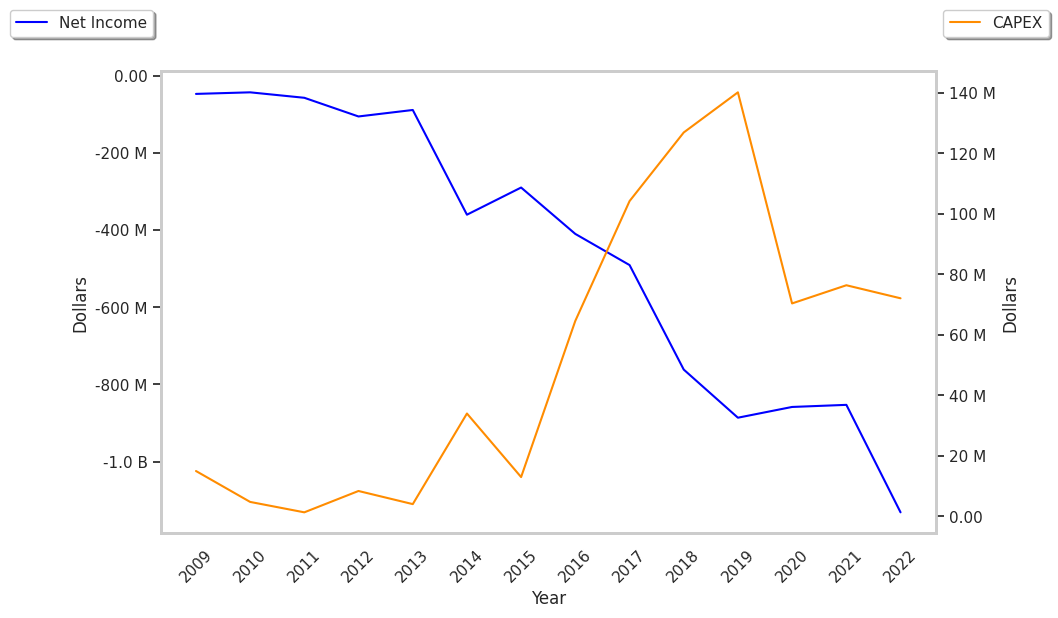
| Net Income (M) | -$858 | -$853 | -$1,131 | -$440 | -$278 | $314 |
| Net Interest Expense (M) | $84 | $143 | $156 | $121 | $68 | $219 |
| Depreciation & Amort. (M) | $35 | $48 | $44 | $54 | $55 | $55 |
| Diluted Shares (M) | 115 | 118 | 122 | 125 | 128 | 135 |
| Earnings Per Share | -$7.46 | -$7.2 | -$9.3 | -$3.52 | -$2.18 | $2.33 |
| EPS Growth | n/a | 3.49% | -29.17% | 62.15% | 38.07% | 206.88% |
| Avg. Price | $131.58 | $167.88 | $147.26 | $191.41 | $236.22 | $303.05 |
| P/E Ratio | -17.64 | -23.32 | -15.83 | -54.38 | -108.36 | 126.8 |
| Free Cash Flow (M) | -$685 | -$718 | -$613 | $42 | -$43 | $465 |
| CAPEX (M) | $70 | $76 | $72 | $62 | $34 | $59 |
| EV / EBITDA | -18.28 | -29.49 | -23.65 | -105.07 | -244.77 | 69.35 |
| Total Debt (M) | $191 | $676 | $678 | $1,021 | $1,025 | $1,008 |
| Net Debt / EBITDA | 0.38 | 0.22 | 0.25 | -0.91 | -0.48 | -1.17 |
| Current Ratio | 4.47 | 4.04 | 3.51 | 3.08 | 2.78 | 2.76 |
Alnylam Pharmaceuticals has an excellent current ratio of 2.76 and rapidly growing revenues and decreasing reinvestment in the business. Additionally, the company's financial statements display positive EPS growth and healthy leverage levels. Furthermore, Alnylam Pharmaceuticals has weak operating margins with a stable trend and negative cash flows.