It's been a great morning session for MetLife investors, who saw their shares rise 1.7% to a price of $87.04 per share. At these higher prices, is the company still fairly valued? If you are thinking about investing, make sure to check the company's fundamentals before making a decision.
Forward Earnings Expected to Increase but Priced Beyond Its Margin of Safety:
MetLife, Inc., a financial services company, provides insurance, annuities, employee benefits, and asset management services worldwide. The company belongs to the Finance sector, which has an average price to earnings (P/E) ratio of 15.92 and an average price to book (P/B) ratio of 1.78. In contrast, MetLife has a trailing 12 month P/E ratio of 16.8 and a P/B ratio of 2.06.
When we divideMetLife's P/E ratio by its expected five-year EPS growth rate, we obtain a PEG ratio of 0.45, which indicates that the market is undervaluing the company's projected growth (a PEG ratio of 1 indicates a fairly valued company). Your analysis of the stock shouldn't end here. Rather, a good PEG ratio should alert you that it may be worthwhile to take a closer look at the stock.
Generally Positive Cash Flows but a Declining EPS Growth Trend:
| 2020 | 2021 | 2022 | 2023 | 2024 | 2025 | |
|---|---|---|---|---|---|---|
| Revenue (M) | $67,842 | $68,696 | $68,770 | $66,905 | $70,986 | $77,084 |
| Interest Income (M) | $632 | $647 | $655 | $740 | $738 | $724 |
| Operating Margins | 10% | 12% | 9% | 9% | 8% | 8% |
| Net Margins | 8% | 10% | 8% | 2% | 6% | 4% |
| Net Income (M) | $5,407 | $6,855 | $5,284 | $1,578 | $4,426 | $3,379 |
| Depreciation & Amort. (M) | $194 | $123 | $118 | $112 | $124 | $117 |
| Diluted Shares (M) | 913 | 869 | 809 | 762 | 711 | 673 |
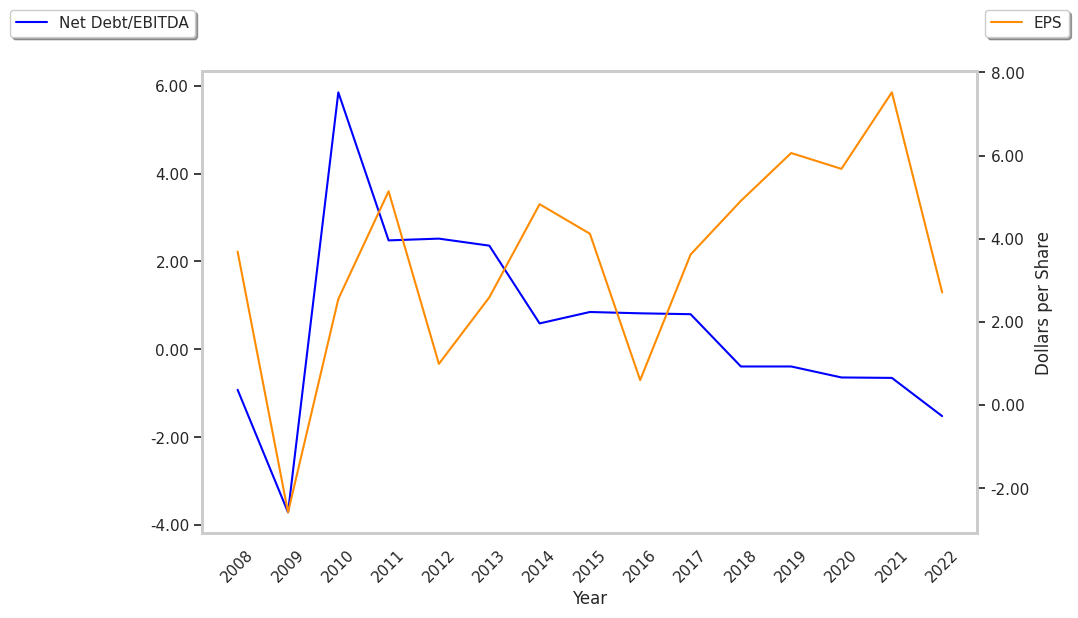
| Earnings Per Share | $5.68 | $7.65 | $6.3 | $1.81 | $5.94 | $4.71 |
| EPS Growth | n/a | 34.68% | -17.65% | -71.27% | 228.18% | -20.71% |
| Avg. Price | $36.3 | $56.92 | $64.26 | $66.13 | $81.76 | $84.49 |
| P/E Ratio | 6.35 | 7.38 | 10.12 | 36.34 | 13.67 | 17.82 |
| Free Cash Flow (M) | $11,639 | $12,347 | $13,044 | $13,721 | $14,598 | $17,092 |
| EV / EBITDA | 2.39 | 3.91 | 5.93 | 5.8 | 6.97 | 6.4 |
| Total Debt (M) | $3,546 | $3,497 | $3,333 | $3,280 | $3,629 | $4,510 |
| Net Debt / EBITDA | -2.28 | -1.92 | -2.77 | -2.97 | -2.69 | -2.8 |
| Current Ratio | 50.37 | 58.79 | 115.4 | 173.44 | 43.16 | 62.06 |
MetLife has generally positive cash flows, an excellent current ratio of 62.06, and low leverage levels. However, the firm suffers from weak operating margins with a negative growth trend and declining EPS growth.