Standing out among the Street's worst performers today is XPO Logistics, a integrated freight & logistics company whose shares slumped -3.4% to a price of $219.91, not far from its average analyst target price of $224.59.
The average analyst rating for the stock is buy. XPO underperformed the S&P 500 index by -3.0% during today's morning session, but outpaced it by 63.3% over the last year with a return of 86.3%.
XPO, Inc., together with its subsidiaries, provides freight transportation services in the United States, North America, France, the United Kingdom, and rest of Europe. The company is a consumer cyclical company, whose sales figures depend on discretionary income levels in its consumer base. For this reason, consumer cyclical companies have better sales and stock performance during periods of economic growth, when consumers have more of an incentive to spend their money on non-essential items.
XPO Logistics's trailing 12 month P/E ratio is 75.6, based on its trailing EPS of $2.91. The company has a forward P/E ratio of 36.6 according to its forward EPS of $6.01 -- which is an estimate of what its earnings will look like in the next quarter. As of the third quarter of 2024, the average Price to Earnings (P/E) ratio for US consumer discretionary companies is 20.93, and the S&P 500 has an average of 29.3. The P/E ratio consists in the stock's share price divided by its earnings per share (EPS), representing how much investors are willing to spend for each dollar of the company's earnings. Earnings are the company's revenues minus the cost of goods sold, overhead, and taxes.
To better understand XPO’s valuation, we can divide its price to earnings ratio by its projected five-year growth rate, which gives us its price to earnings, or PEG ratio. Considering the P/E ratio in the context of growth is important, because many companies that are undervalued in terms of earnings are actually overvalued in terms of growth.
XPO Logistics’s PEG is 2.49, which indicates that the company is overvalued compared to its growth prospects. Bear in mind that PEG ratios have limits to their relevance, since they are based on future growth estimates that may not turn out as expected.
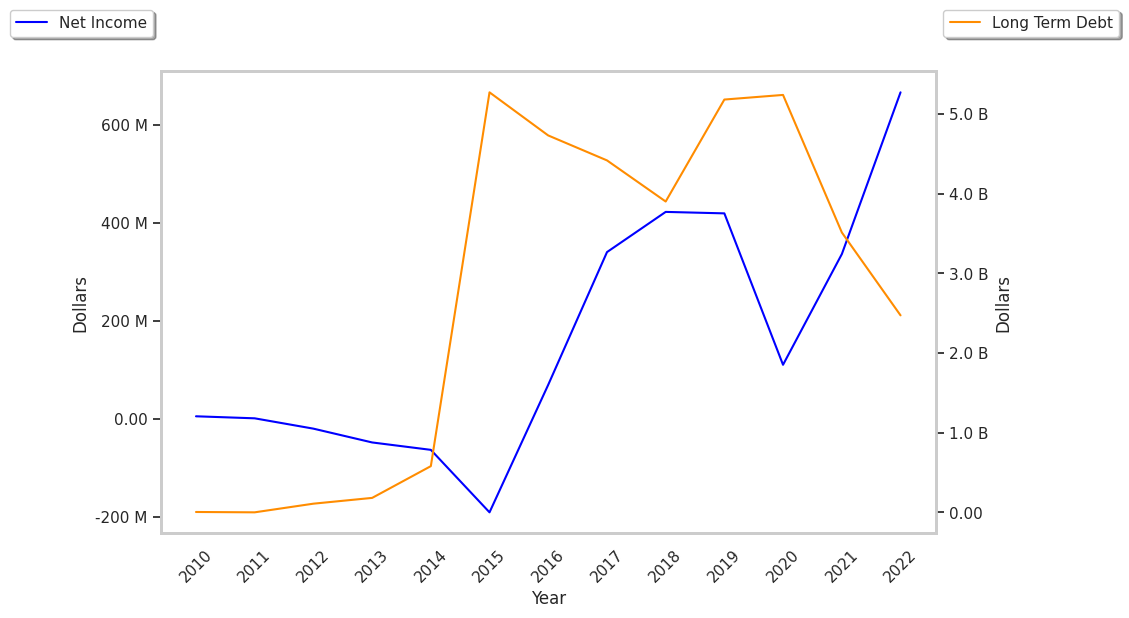
When we subtract capital expenditures from operating cash flows, we are left with the company's free cash flow, which for XPO Logistics was $329.0 Million as of its last annual report. Free cash flow represents the amount of money available for reinvestment in the business or for payments to equity investors in the form of a dividend. In XPO's case the cash flow outlook is weak. It's average cash flow over the last 4 years has been $56.33 Million and they've been growing at an average rate of 4.6%.
Another valuation metric for analyzing a stock is its Price to Book (P/B) Ratio, which consists in its share price divided by its book value per share. The book value refers to the present liquidation value of the company, as if it sold all of its assets and paid off all debts). Xpo logistics's P/B ratio is 13.82 -- in other words, the market value of the company exceeds its book value by a factor of more than 13, so the company's assets may be overvalued compared to the average P/B ratio of the Consumer Discretionary sector, which stands at 2.93 as of the third quarter of 2024.
XPO Logistics is likely overvalued at today's prices because it has a higher P/E ratio than its sector average, a higher than Average P/B Ratio, and positive cash flows with a flat trend. The stock has mixed growth prospects because of its decent operating margins with a positive growth rate, and an inflated PEG ratio. We hope this preliminary analysis will encourage you to do your own research into XPO's fundamental values -- especially their trends over the last few years, which provide the clearest picture of the company's valuation.