Now trading at a price of $259.36, Nucor has moved -2.6% so far today.
Nucor returned gains of 118.9% last year, with its stock price reaching a high of $270.9 and a low of $120.4. Over the same period, the stock outperformed the S&P 500 index by 95.7%. More recently, the company's 50-day average price was $223.58. Nucor Corporation engages in the manufacture and sale of steel and steel products. Based in Charlotte, NC, the Large-Cap Industrials company has 33,000 full time employees. Nucor has returned a 0.8% dividend yield over the last 12 months, but this may not be sustainable seen that the company has a choppy cash flow record.
Positive Cash Flows:
| 2020 | 2021 | 2022 | 2023 | 2024 | 2025 | |
|---|---|---|---|---|---|---|
| Revenue (M) | $20,140 | $36,484 | $41,512 | $34,714 | $30,734 | $32,494 |
| Operating Margins | 4% | 25% | 25% | 18% | 9% | 8% |
| Net Margins | 4% | 19% | 18% | 13% | 7% | 5% |
| Net Income (M) | $721 | $6,827 | $7,607 | $4,525 | $2,027 | $1,744 |
| Net Interest Expense (M) | $167 | $163 | $219 | $246 | $228 | $170 |
| Depreciation & Amort. (M) | $702 | $735 | $827 | $931 | $1,094 | $1,226 |
| Diluted Shares (M) | 303 | 293 | 263 | 250 | 238 | 231 |
| Earnings Per Share | $2.36 | $23.16 | $28.79 | $18.0 | $8.46 | $7.52 |
| EPS Growth | n/a | 881.36% | 24.31% | -37.48% | -53.0% | -11.11% |
| Avg. Price | $42.51 | $89.84 | $125.5 | $174.04 | $116.98 | $254.39 |
| P/E Ratio | 17.94 | 3.87 | 4.35 | 9.64 | 13.81 | 33.78 |
| Free Cash Flow (M) | $1,154 | $4,609 | $8,124 | $4,898 | $806 | -$188 |
| CAPEX (M) | $1,543 | $1,622 | $1,948 | $2,214 | $3,173 | $3,422 |
| EV / EBITDA | 10.04 | 3.02 | 3.26 | 6.13 | 7.84 | 16.71 |
| Total Debt (M) | $5,283 | $5,577 | $6,642 | $6,723 | $6,725 | $6,999 |
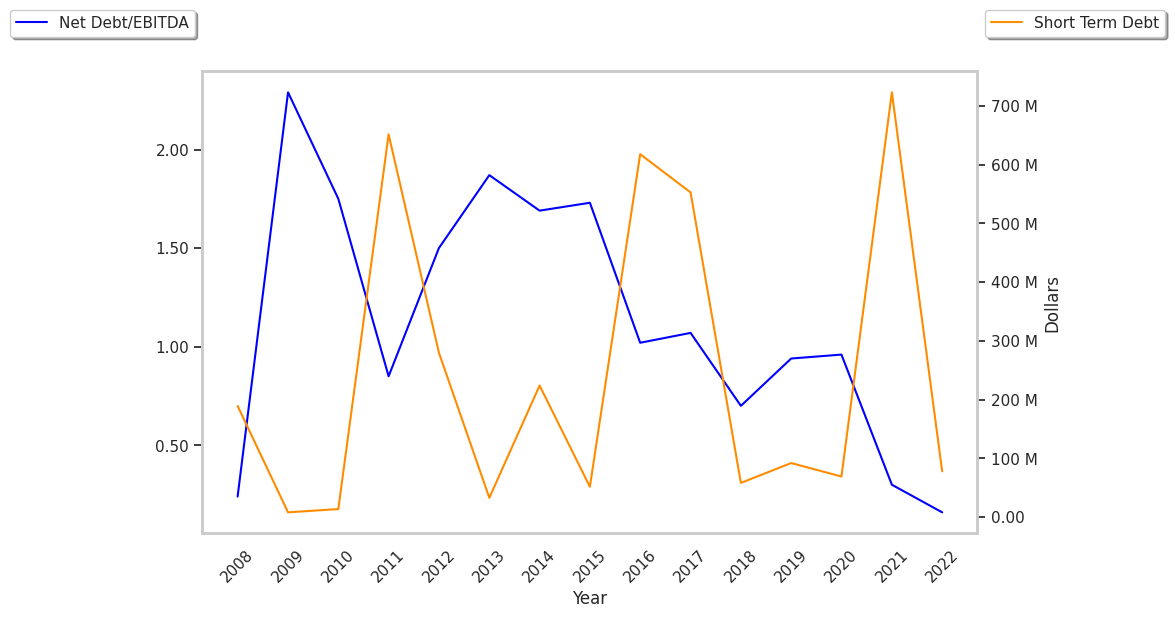
| Net Debt / EBITDA | 1.72 | 0.32 | 0.21 | 0.05 | 0.79 | 1.25 |
| Current Ratio | 3.61 | 2.48 | 3.39 | 3.57 | 2.51 | 2.94 |
Nucor has exceptional EPS growth and an excellent current ratio of 2.94. Additionally, the company's financial statements display slight revenue growth and increasing reinvestment in the business and healthy leverage levels. However, the firm has positive cash flows. Finally, we note that Nucor has decent operating margins with a negative growth trend.
Forward Earnings Expected to Increase but Priced Beyond Its Margin of Safety:
Nucor has a trailing twelve month P/E ratio of 22.2, compared to an average of 24.03 for the Industrials sector. Based on its EPS guidance of $16.56, the company has a forward P/E ratio of 13.5. According to the 32.1% compound average growth rate of Nucor's historical and projected earnings per share, the company's PEG ratio is 0.69. Taking the weighted average of the company's EPS CAGR and the broader market's 5-year projected EPS growth rate, we obtain a normalized growth rate of 17.3%. On this basis, the company's PEG ratio is 1.28. This implies that the shares are fairly valued. Additionally, the market is possibly undervaluing Nucor in terms of its equity because its P/B ratio is 2.75 whereas the sector average is 2.89. The company's shares are currently trading 109.4% below their Graham number.
There's an Analyst Consensus of Little Upside Potential for Nucor:
The 15 analysts following Nucor have set target prices ranging from $138.17 to $292.0 per share, for an average of $256.81 with a buy rating.
Nucor has an average amount of shares sold short because 2.2% of the company's shares are sold short. Institutions own 79.6% of the company's shares, and the insider ownership rate stands at 2.08%, suggesting a large amount of insider shareholders. The largest shareholder is State Farm Mutual Automobile Insurance Co, whose 11% stake in the company is worth $6,278,536,531.