Now trading at a price of $45.72, CNA Financial has moved 2.7% so far today.
Over the last year, CNA Financial logged a -2.8% change, with its stock price reaching a high of $50.72 and a low of $41.53. Over the same period, the stock underperformed the S&P 500 index by -27.3%. AThe company's 50-day average price was $45.14. CNA Financial Corporation, an insurance holding company, primarily provides commercial property and casualty insurance products in the United States, Canada, the United Kingdom, Continental Europe, and internationally. Based in Chicago, IL, the Large-Cap Finance company has 6,600 full time employees. CNA Financial has offered a 4.2% dividend yield over the last 12 months.
Growing Revenues and Good EPS Growth:
| 2020 | 2021 | 2022 | 2023 | 2024 | 2025 | |
|---|---|---|---|---|---|---|
| Revenue (M) | $10,808 | $11,908 | $11,879 | $13,299 | $14,270 | $14,989 |
| Operating Margins | 8% | 12% | 7% | 11% | 8% | 11% |
| Net Margins | 6% | 10% | 6% | 9% | 7% | 9% |
| Net Income (M) | $690 | $1,184 | $682 | $1,205 | $959 | $1,278 |
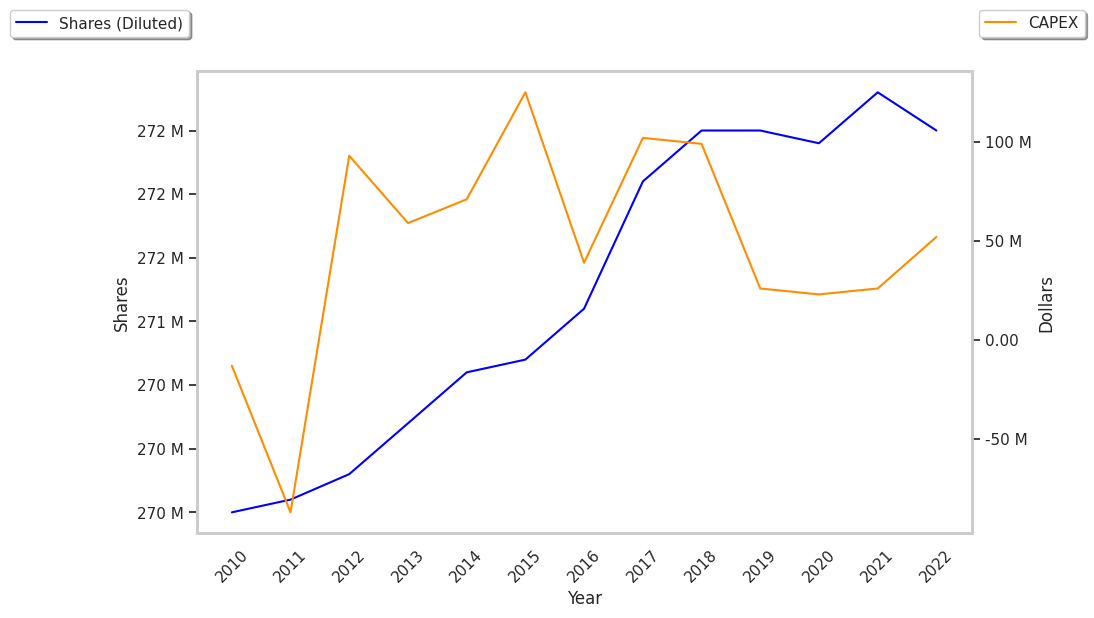
| Diluted Shares (M) | 272 | 273 | 272 | 272 | 273 | 272 |
| Earnings Per Share | $2.53 | $4.34 | $2.51 | $4.43 | $3.52 | $4.69 |
| EPS Growth | n/a | 71.54% | -42.17% | 76.49% | -20.54% | 33.24% |
| Avg. Price | $28.3 | $38.46 | $42.34 | $42.31 | $48.4 | $43.66 |
| P/E Ratio | 11.14 | 8.82 | 16.87 | 9.53 | 13.71 | 9.27 |
| Free Cash Flow (M) | $1,752 | $1,971 | $2,450 | $2,195 | $2,476 | $2,404 |
| CAPEX (M) | $23 | $26 | $52 | $90 | $95 | $86 |
| EV / EBITDA | -41.95 | -22.47 | -29.44 | -17.64 | 12.22 | 8.5 |
| Total Debt (M) | $2,776 | $2,779 | $3,024 | $3,581 | $2,973 | $2,971 |
| Net Debt / EBITDA | -50.67 | -29.36 | -42.72 | -24.85 | 1.96 | 1.51 |
CNA Financial has growing revenues and increasing reinvestment in the business and generally positive cash flows. Additionally, the company's financial statements display low leverage levels and a strong EPS growth trend. Furthermore, CNA Financial has weak operating margins with a stable trend.
CNA Financial Has Attractive Multiples and Its Shares Are on Sale:
CNA Financial has a trailing twelve month P/E ratio of 10.1, compared to an average of 15.92 for the Finance sector. Based on its EPS guidance of $4.8, the company has a forward P/E ratio of 9.4. The 9.6% compound average growth rate of CNA Financial's historical and projected earnings per share yields a PEG ratio of 1.05. This implies that the shares are fairly valued. Additionally, the market is possibly undervaluing CNA Financial in terms of its equity because its P/B ratio is 1.14 whereas the sector average is 1.78. The company's shares are currently trading -31.9% above their Graham number.
CNA Financial Has a Small Amount of Insider Shareholders:
CNA Financial has an above average percentage of its shares sold short because 13.3% of the company's shares are sold short. Institutions own 100.1% of the company's shares, and the insider ownership rate stands at 0.49%, suggesting a small amount of insider investors. The largest shareholder is Loews Corp, whose 92% stake in the company is worth $11,357,522,124.