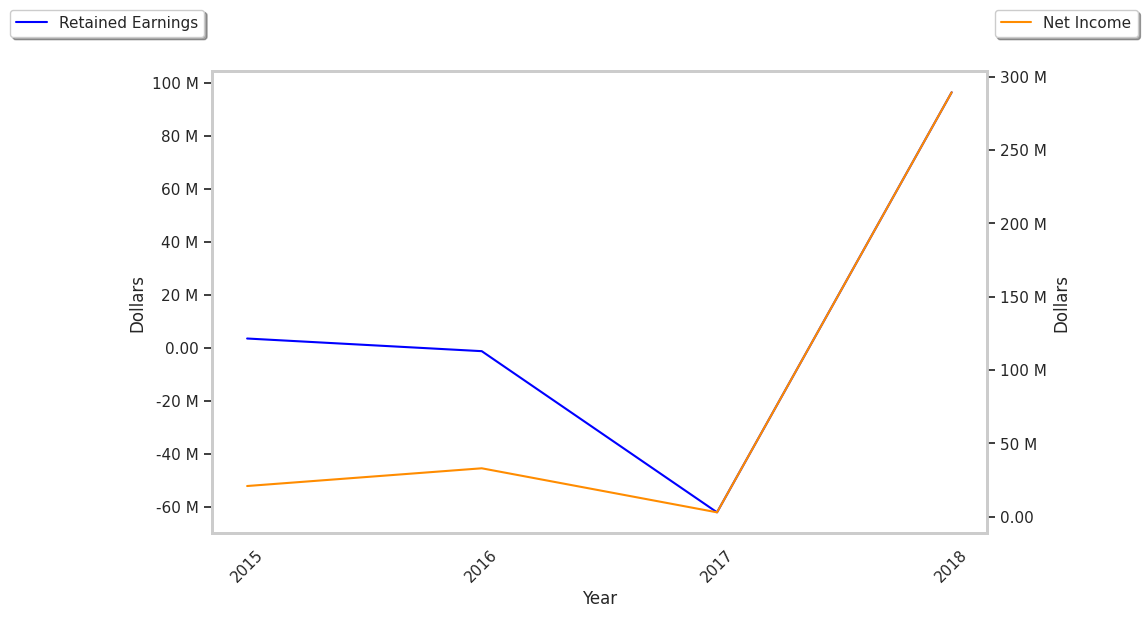
One of Wall Street's biggest winners of the day is Virtu Financial, a capital markets company whose shares have climbed 3.9% to a price of $66.76 -- 23.3% above its average analyst target price of $54.14.
The average analyst rating for the stock is hold. VIRT outperformed the S&P 500 index by 3.0% during today's afternoon session, and by 26.8% over the last year with a return of 45.9%.
Virtu Financial, Inc. operates as a financial services company in the United States, Ireland, and internationally. The company is part of the financial services sector, alongside a staggering variety of banking, mortgage, insurance,and credit service companies. If there is one common denominator among all companies in the sector, it’s that they are all dedicated to maintaining and developing new systems for the storage and transfer of value and risk.
Virtu Financial's trailing 12 month P/E ratio is 11.1, based on its trailing EPS of $6.04. The company has a forward P/E ratio of 11.2 according to its forward EPS of $5.95 -- which is an estimate of what its earnings will look like in the next quarter.
As of the third quarter of 2024, the average Price to Earnings (P/E) ratio for US finance companies is 15.92, and the S&P 500 has an average of 29.3. The P/E ratio consists in the stock's share price divided by its earnings per share (EPS), representing how much investors are willing to spend for each dollar of the company's earnings. Earnings are the company's revenues minus the cost of goods sold, overhead, and taxes.
Virtu Financial's financial viability can also be assessed through a review of its free cash flow trends. Free cash flow refers to the company's operating cash flows minus its capital expenditures, which are expenses related to the maintenance of fixed assets such as land, infrastructure, and equipment. Over the last four years, the trends have been as follows:
| Date Reported | Cash Flow from Operations ($ k) | Capital expenditures ($ k) | Free Cash Flow ($ k) | YoY Growth (%) |
|---|---|---|---|---|
| 2025 | 518,386 | 22,802 | 495,584 | -15.51 |
| 2024 | 598,991 | 12,427 | 586,564 | 29.2 |
| 2023 | 491,777 | 37,774 | 454,003 | -33.2 |
| 2022 | 706,803 | 27,201 | 679,602 | -40.75 |
| 2021 | 1,171,626 | 24,562 | 1,147,064 | 11.15 |
| 2020 | 1,060,884 | 28,888 | 1,031,996 |
- Average free cash flow: $732.47 Million
- Average free cash flown growth rate: -14.6 %
- Coefficient of variability (lower numbers indicating more stability): 0.0 %
With its positive cash flow, the company can not only re-invest in its business, it can offer regular returns to its equity investors in the form of dividends. Over the last 12 months, investors in VIRT have received an annualized dividend yield of 1.5% on their capital.
Value investors often analyze stocks through the lens of its Price to Book (P/B) Ratio (market value divided by book value). The book value refers to the present value of the company if the company were to sell off all of its assets and pay all of its debts today - a number whose value may differ significantly depending on the accounting method.
Virtu Financial's P/B ratio indicates that the market value of the company exceeds its book value by a factor of 3, so the company's assets may be overvalued compared to the average P/B ratio of the Finance sector, which stands at 1.78 as of the third quarter of 2024.
With a Very low P/E ratio, an average P/B ratio, and positive cash flows with a downwards trend, we can conclude that Virtu Financial is probably overvalued at current prices. The stock presents poor growth indicators because of its decent operating margins with a negative growth trend, and an inflated PEG ratio.